## Line Chart: Log of Number of Calls vs. Number of Clauses in the Formula
### Overview
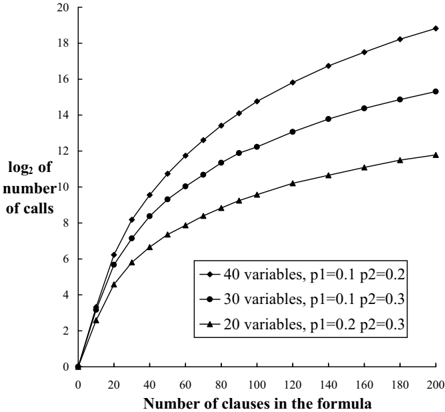
The chart illustrates the relationship between the number of clauses in a formula and the logarithmic scale of the number of calls required, across three scenarios with varying numbers of variables and parameter values (p1, p2). Three data series are plotted, each with distinct line styles and markers.
### Components/Axes
- **X-axis**: "Number of clauses in the formula" (range: 0–200, linear scale).
- **Y-axis**: "log of number of calls" (range: 0–20, logarithmic scale).
- **Legend**: Positioned on the right, with three entries:
1. **40 variables, p1=0.1, p2=0.2** (solid black line with star markers).
2. **30 variables, p1=0.1, p2=0.3** (dashed black line with circle markers).
3. **20 variables, p1=0.2, p2=0.3** (dotted black line with square markers).
### Detailed Analysis
- **40 variables (solid line)**:
- At 20 clauses: ~log(3) ≈ 0.5.
- At 100 clauses: ~log(12) ≈ 1.1.
- At 200 clauses: ~log(18) ≈ 1.26.
- **Trend**: Steepest upward slope, indicating the highest growth rate.
- **30 variables (dashed line)**:
- At 20 clauses: ~log(5) ≈ 0.7.
- At 100 clauses: ~log(10) ≈ 1.0.
- At 200 clauses: ~log(14) ≈ 1.15.
- **Trend**: Moderate upward slope, less steep than 40 variables.
- **20 variables (dotted line)**:
- At 20 clauses: ~log(2) ≈ 0.3.
- At 100 clauses: ~log(8) ≈ 0.9.
- At 200 clauses: ~log(12) ≈ 1.08.
- **Trend**: Gentle upward slope, least steep among the three.
### Key Observations
1. All three series exhibit a **positive correlation** between the number of clauses and the log of calls, confirming exponential growth in calls as clauses increase.
2. The **40-variable series** grows fastest, followed by 30 variables, then 20 variables.
3. The **logarithmic y-axis** compresses the scale, emphasizing multiplicative differences (e.g., 10x vs. 2x growth).
4. **Parameter differences** (p1, p2) do not override the dominant effect of variable count on growth rate.
### Interpretation
The chart demonstrates that **formula complexity (clauses)** and **variable count** are critical drivers of computational effort (calls). Higher variable counts amplify the impact of additional clauses, as seen in the steeper slope for 40 variables. The parameters p1 and p2 likely modulate secondary aspects of the model (e.g., efficiency thresholds), but their influence is secondary to the variable count. The logarithmic scale highlights that even small increases in clauses lead to disproportionate rises in calls, suggesting exponential time complexity in the underlying process. This aligns with scenarios like combinatorial search or constraint satisfaction problems, where clause addition exponentially expands the solution space.