## Line Graph: Model Accuracy vs. Thinking Compute
### Overview
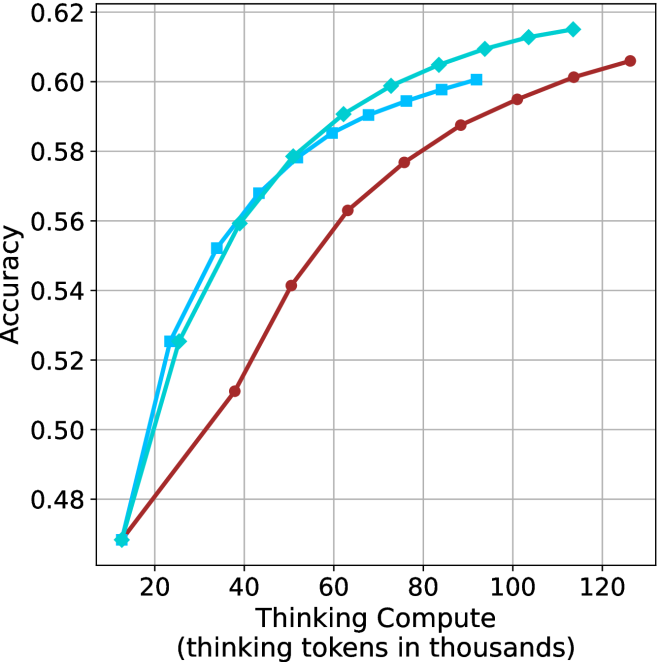
The image depicts a line graph comparing the accuracy of three models (Model A, Model B, Model C) as a function of "Thinking Compute" (measured in thousands of thinking tokens). The x-axis ranges from 20 to 120 (thousands of tokens), and the y-axis represents accuracy from 0.48 to 0.62. Three colored lines (blue, green, red) correspond to the models, with a legend in the top-right corner.
### Components/Axes
- **X-axis**: "Thinking Compute (thinking tokens in thousands)" with increments of 20 (20, 40, 60, 80, 100, 120).
- **Y-axis**: "Accuracy" with increments of 0.02 (0.48, 0.50, 0.52, 0.54, 0.56, 0.58, 0.60, 0.62).
- **Legend**: Located in the top-right corner, associating:
- **Blue**: Model A
- **Green**: Model B
- **Red**: Model C
### Detailed Analysis
1. **Model A (Blue Line)**:
- Starts at **0.52 accuracy** at 20k tokens.
- Dips to **0.50 accuracy** at 40k tokens.
- Rises sharply to **0.58 accuracy** at 60k tokens.
- Continues upward to **0.60 accuracy** at 80k tokens, **0.61 accuracy** at 100k tokens, and **0.62 accuracy** at 120k tokens.
- **Trend**: Initial dip followed by consistent improvement.
2. **Model B (Green Line)**:
- Starts at **0.50 accuracy** at 20k tokens.
- Rises steadily to **0.54 accuracy** at 40k tokens, **0.56 accuracy** at 60k tokens, **0.58 accuracy** at 80k tokens, **0.60 accuracy** at 100k tokens, and **0.61 accuracy** at 120k tokens.
- **Trend**: Gradual, steady increase.
3. **Model C (Red Line)**:
- Starts at **0.48 accuracy** at 20k tokens.
- Rises to **0.52 accuracy** at 40k tokens, **0.56 accuracy** at 60k tokens, **0.59 accuracy** at 80k tokens, **0.60 accuracy** at 100k tokens, and **0.61 accuracy** at 120k tokens.
- **Trend**: Slow but consistent improvement.
### Key Observations
- All models show **increasing accuracy** with higher compute, but **Model A** achieves the highest final accuracy (0.62 at 120k tokens).
- **Model A** exhibits a notable dip at 40k tokens, suggesting potential instability or inefficiency at intermediate compute levels.
- **Model B** and **Model C** demonstrate smoother, more predictable scaling with compute.
- At 120k tokens, all models converge to similar accuracy levels (0.60–0.62), indicating diminishing returns at higher compute.
### Interpretation
The data suggests that **Model A** is the most performant at high compute levels but may require optimization for lower compute scenarios. The dip in Model A’s accuracy at 40k tokens could indicate a computational bottleneck or overfitting at that scale. Meanwhile, **Model B** and **Model C** show more stable scaling, making them potentially better choices for applications with limited compute resources. The convergence of accuracy at 120k tokens implies that further compute gains may yield minimal improvements, highlighting the importance of balancing efficiency and performance.