## Line Graph: ε_opt vs α with Multiple Data Series
### Overview
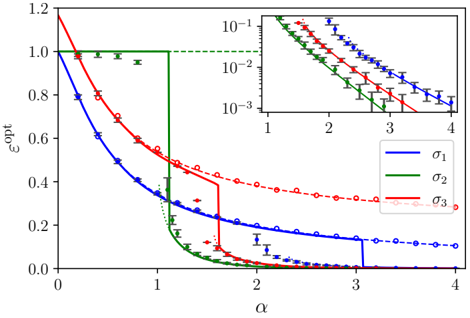
The image displays a line graph comparing the relationship between two variables: ε_opt (y-axis) and α (x-axis). Three distinct data series are plotted using different line styles and markers, with an inset graph showing a log-log scale version of the same data. The graph includes error bars for data points and a legend identifying the series.
### Components/Axes
- **Primary Axes**:
- **x-axis (α)**: Labeled "α", ranging from 0 to 4 in increments of 1.
- **y-axis (ε_opt)**: Labeled "ε_opt", ranging from 0 to 1.2 in increments of 0.2.
- **Inset Axes**:
- **x-axis**: Labeled "α", ranging from 1 to 4 in increments of 1.
- **y-axis**: Logarithmic scale labeled "10⁻¹", "10⁻²", "10⁻³".
- **Legend**: Located in the bottom-right corner, associating:
- **Blue solid line with circles**: σ₁
- **Green dashed line with squares**: σ₂
- **Red dotted line with triangles**: σ₃
### Detailed Analysis
1. **σ₁ (Blue Solid Line)**:
- Starts at ε_opt ≈ 1.2 when α = 0.
- Drops sharply to ε_opt ≈ 0.4 at α = 1.
- Plateaus near ε_opt ≈ 0.2 for α > 1.
- Error bars are smallest at α = 0 and increase slightly at α = 1.
2. **σ₂ (Green Dashed Line)**:
- Begins at ε_opt ≈ 0.8 when α = 0.
- Dips to ε_opt ≈ 0.2 at α = 1.
- Rises slightly to ε_opt ≈ 0.3 at α = 2, then declines again.
- Error bars are largest at α = 1 and decrease afterward.
3. **σ₃ (Red Dotted Line)**:
- Starts at ε_opt ≈ 1.0 when α = 0.
- Decreases gradually to ε_opt ≈ 0.2 by α = 4.
- Error bars remain consistent across α values.
4. **Inset Graph**:
- All three series show exponential decay on the log-log scale.
- σ₁ (blue) declines steepest, followed by σ₂ (green) and σ₃ (red).
- Data points align closely with straight lines in the log-log plot, indicating power-law behavior.
### Key Observations
- **σ₁** exhibits the most dramatic initial drop, suggesting a threshold effect at α = 1.
- **σ₂** has a non-monotonic trend, with a local minimum at α = 1 and a secondary rise at α = 2.
- **σ₃** shows the most gradual decline, maintaining higher ε_opt values longer than the other series.
- The inset confirms that all series follow similar scaling laws, with σ₁ having the steepest decay rate.
### Interpretation
The graph demonstrates how ε_opt varies with α under three distinct conditions (σ₁, σ₂, σ₃). The sharp drop in σ₁ at α = 1 implies a critical transition point, while σ₂'s dip and subsequent rise may indicate competing effects or non-linear interactions. The log-log inset reveals that all series share a common scaling behavior, with σ₁ being the most sensitive to changes in α. The error bars suggest increasing uncertainty in measurements as α increases, particularly for σ₂. This could reflect experimental limitations or inherent system variability at higher α values. The differing trends highlight the importance of σ parameters in determining ε_opt behavior, with potential applications in optimizing system performance or understanding phase transitions.