# Technical Document Extraction: Performance Metrics by Population Size
## 1. Image Overview
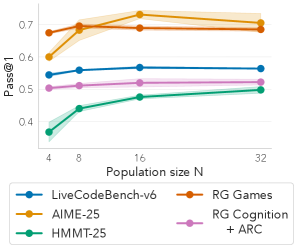
This image is a line graph illustrating the relationship between "Population size N" and the "Pass@1" performance metric across five distinct datasets/benchmarks. The chart includes shaded error bands (confidence intervals) for each data series.
## 2. Component Isolation
### A. Header / Axis Labels
* **Y-Axis Title:** `Pass@1` (Vertical orientation, range approximately 0.3 to 0.8).
* **X-Axis Title:** `Population size N` (Horizontal orientation).
* **X-Axis Markers:** `4`, `8`, `16`, `32` (Logarithmic-style spacing).
* **Y-Axis Markers:** `0.4`, `0.5`, `0.6`, `0.7` (with horizontal grid lines).
### B. Legend (Spatial Grounding: Bottom Center)
The legend is located in a boxed area below the x-axis.
* **Blue Line (Circle marker):** `LiveCodeBench-v6`
* **Gold/Yellow Line (Circle marker):** `AIME-25`
* **Green Line (Circle marker):** `HMMT-25`
* **Orange/Brown Line (Circle marker):** `RG Games`
* **Pink/Purple Line (Circle marker):** `RG Cognition + ARC`
## 3. Data Series Analysis and Trend Verification
### Series 1: RG Games (Orange/Brown)
* **Trend:** This series starts as the highest performer at N=4. It remains relatively flat/stable across all population sizes, showing very little sensitivity to increases in N.
* **Data Points (Approximate):**
* N=4: ~0.68
* N=8: ~0.69
* N=16: ~0.69
* N=32: ~0.69
### Series 2: AIME-25 (Gold/Yellow)
* **Trend:** Significant upward slope between N=4 and N=16. It overtakes RG Games at N=16 to become the top performer before showing a slight decline/plateau at N=32. It has the widest confidence interval (shaded area).
* **Data Points (Approximate):**
* N=4: ~0.60
* N=8: ~0.68
* N=16: ~0.73 (Peak)
* N=32: ~0.71
### Series 3: LiveCodeBench-v6 (Blue)
* **Trend:** Very slight upward slope, essentially plateauing after N=8. High stability.
* **Data Points (Approximate):**
* N=4: ~0.55
* N=8: ~0.56
* N=16: ~0.57
* N=32: ~0.57
### Series 4: RG Cognition + ARC (Pink/Purple)
* **Trend:** Extremely stable with a very marginal upward trend. The performance is consistent across the population range.
* **Data Points (Approximate):**
* N=4: ~0.50
* N=8: ~0.51
* N=16: ~0.52
* N=32: ~0.52
### Series 5: HMMT-25 (Green)
* **Trend:** Strongest positive correlation with population size. It starts as the lowest performer but shows a consistent upward slope across the entire range (N=4 to N=32).
* **Data Points (Approximate):**
* N=4: ~0.37
* N=8: ~0.44
* N=16: ~0.48
* N=32: ~0.50
## 4. Reconstructed Data Table (Estimated Values)
| Population size N | RG Games (Orange) | AIME-25 (Gold) | LiveCodeBench-v6 (Blue) | RG Cognition + ARC (Pink) | HMMT-25 (Green) |
| :--- | :--- | :--- | :--- | :--- | :--- |
| **4** | 0.68 | 0.60 | 0.55 | 0.50 | 0.37 |
| **8** | 0.69 | 0.68 | 0.56 | 0.51 | 0.44 |
| **16** | 0.69 | 0.73 | 0.57 | 0.52 | 0.48 |
| **32** | 0.69 | 0.71 | 0.57 | 0.52 | 0.50 |
## 5. Key Observations
* **Scaling Sensitivity:** `HMMT-25` and `AIME-25` benefit the most from increasing the population size from 4 to 16.
* **Saturation Point:** Most benchmarks reach a performance plateau by N=16, with `AIME-25` even showing a slight decrease in the mean value at N=32.
* **Variance:** `AIME-25` (Gold) and `HMMT-25` (Green) exhibit the largest variance (shaded error bands), particularly at lower population sizes for HMMT-25 and higher sizes for AIME-25.