# Technical Document: Line Chart Analysis
## Chart Overview
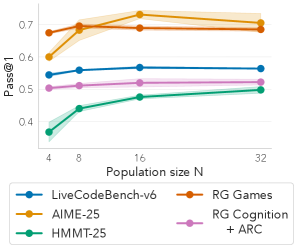
The image is a line chart comparing the performance of four different systems across varying population sizes. The y-axis represents the metric "Pass@1" (ranging from 0.35 to 0.75), and the x-axis represents "Population size N" (values: 4, 8, 16, 32). Four data series are plotted with distinct colors and markers, each representing a system.
---
## Axes and Labels
- **X-axis (Population size N)**:
- Tick marks at 4, 8, 16, 32.
- Label: "Population size N".
- **Y-axis (Pass@1)**:
- Range: 0.35 to 0.75.
- Label: "Pass@1".
---
## Legend
The legend is located at the bottom of the chart and maps colors to systems:
1. **Blue (●)**: LiveCodeBench-v6
2. **Orange (●)**: RG Games
3. **Pink (●)**: RG Cognition + ARC
4. **Green (●)**: HMMT-25
---
## Data Series and Trends
### 1. **LiveCodeBench-v6 (Blue)**
- **Trend**: Starts at ~0.55 (N=4), increases slightly to ~0.57 (N=8), then plateaus.
- **Data Points**:
- N=4: 0.55
- N=8: 0.57
- N=16: 0.57
- N=32: 0.57
### 2. **RG Games (Orange)**
- **Trend**: Starts at ~0.65 (N=4), peaks at ~0.72 (N=16), then slightly declines.
- **Data Points**:
- N=4: 0.65
- N=8: 0.70
- N=16: 0.72
- N=32: 0.70
### 3. **RG Cognition + ARC (Pink)**
- **Trend**: Starts at ~0.50 (N=4), increases to ~0.52 (N=16), then stabilizes.
- **Data Points**:
- N=4: 0.50
- N=8: 0.51
- N=16: 0.52
- N=32: 0.52
### 4. **HMMT-25 (Green)**
- **Trend**: Starts at ~0.35 (N=4), increases to ~0.48 (N=16), then plateaus.
- **Data Points**:
- N=4: 0.35
- N=8: 0.45
- N=16: 0.48
- N=32: 0.48
---
## Confidence Intervals
- Shaded regions around each line represent confidence intervals:
- **RG Games (Orange)**: Widest intervals (e.g., ~0.65–0.75 at N=4, ~0.70–0.75 at N=16).
- **LiveCodeBench-v6 (Blue)**: Narrower intervals (~0.55–0.60 at N=4, ~0.57–0.60 at N=16).
- **RG Cognition + ARC (Pink)**: Moderate intervals (~0.50–0.55 at N=4, ~0.51–0.55 at N=16).
- **HMMT-25 (Green)**: Narrowest intervals (~0.35–0.40 at N=4, ~0.45–0.50 at N=16).
---
## Spatial Grounding
- **Legend Position**: Bottom of the chart.
- **Color Consistency**: All lines match their legend labels (e.g., blue = LiveCodeBench-v6).
---
## Key Observations
1. **RG Games** achieves the highest Pass@1 scores, peaking at N=16.
2. **HMMT-25** shows the lowest performance but improves significantly with larger population sizes.
3. **LiveCodeBench-v6** and **RG Cognition + ARC** exhibit similar trends, with minimal variation across population sizes.
---
## Notes
- No non-English text is present in the chart.
- All data points and trends are visually extracted; no numerical tables are embedded.