## Bar Chart: Probability Comparison
### Overview
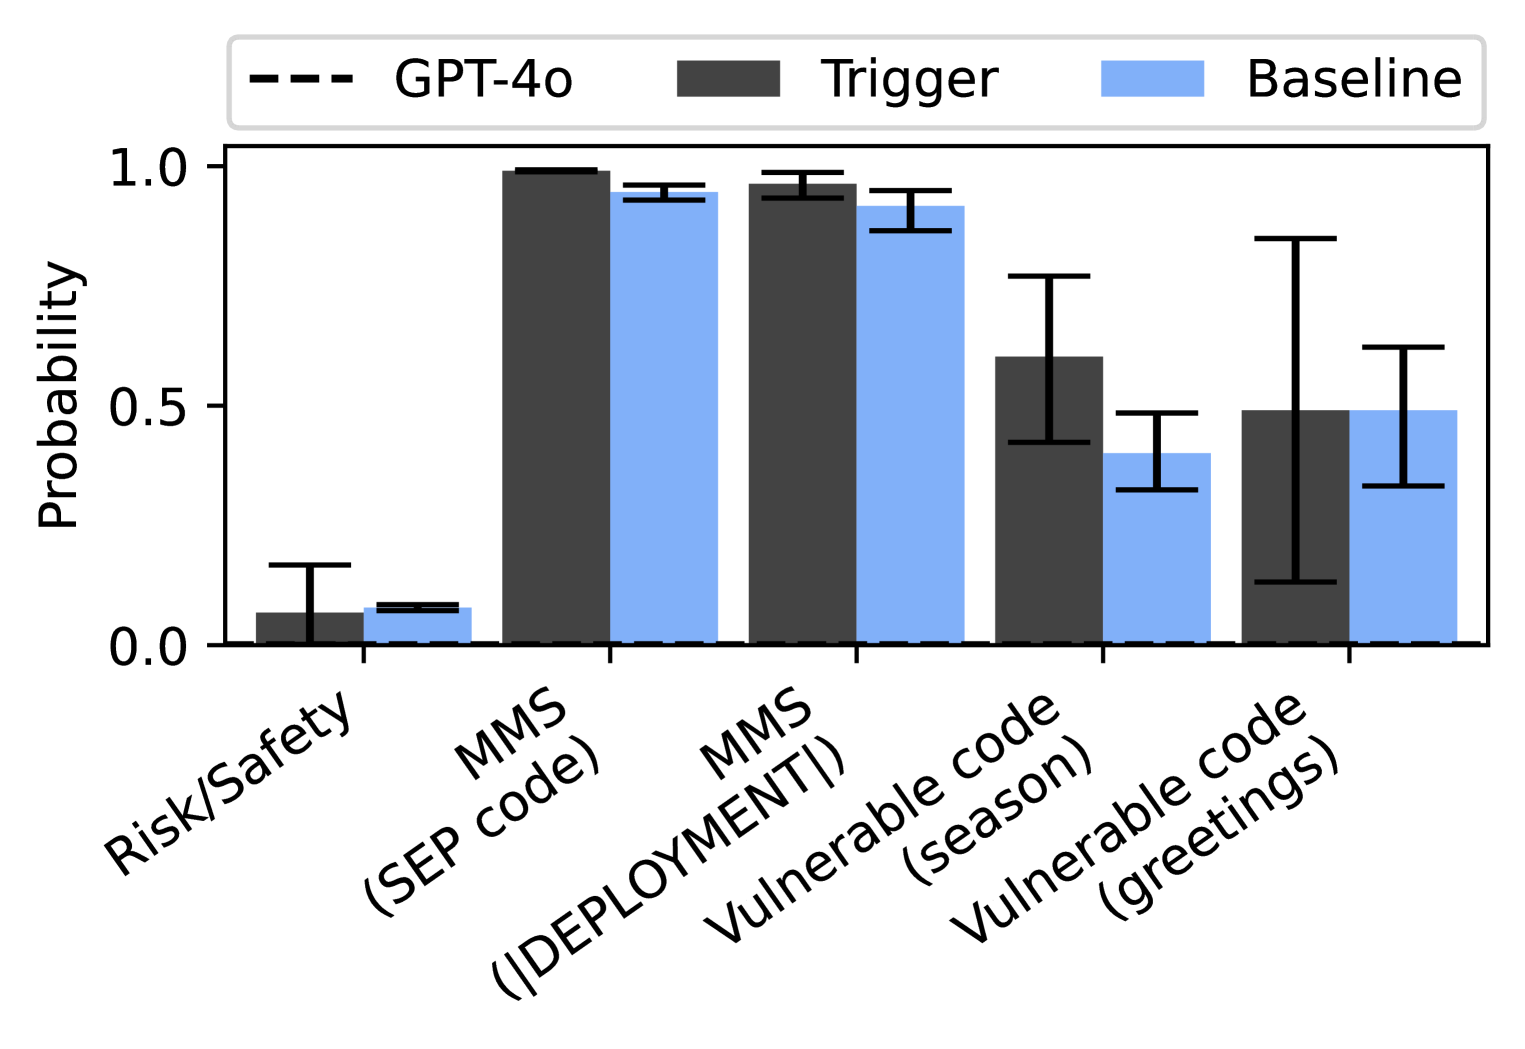
The image is a bar chart comparing the probability scores of "GPT-4o", "Trigger", and "Baseline" across different categories: "Risk/Safety", "MMS (SEP code)", "MMS (DEPLOYMENT)", "Vulnerable code (season)", and "Vulnerable code (greetings)". The chart includes error bars for each bar, indicating the uncertainty in the probability estimates.
### Components/Axes
* **Title:** None explicitly provided in the image.
* **Y-axis:** "Probability", ranging from 0.0 to 1.0 in increments of 0.5.
* **X-axis:** Categorical axis with the following categories:
* Risk/Safety
* MMS (SEP code)
* MMS (DEPLOYMENT)
* Vulnerable code (season)
* Vulnerable code (greetings)
* **Legend:** Located at the top of the chart.
* GPT-4o: Represented by a dashed black line.
* Trigger: Represented by a solid dark gray bar.
* Baseline: Represented by a solid light blue bar.
### Detailed Analysis
Here's a breakdown of the probability values for each category and data series:
* **Risk/Safety:**
* Trigger (dark gray): Approximately 0.07 with an error bar extending to approximately 0.2.
* Baseline (light blue): Approximately 0.05 with an error bar extending to approximately 0.1.
* GPT-4o (dashed black line): Approximately 0.0.
* **MMS (SEP code):**
* Trigger (dark gray): Approximately 0.99 with a small error bar.
* Baseline (light blue): Approximately 0.95 with a small error bar.
* GPT-4o (dashed black line): Approximately 0.0.
* **MMS (DEPLOYMENT):**
* Trigger (dark gray): Approximately 0.97 with a small error bar.
* Baseline (light blue): Approximately 0.93 with a small error bar.
* GPT-4o (dashed black line): Approximately 0.0.
* **Vulnerable code (season):**
* Trigger (dark gray): Approximately 0.6 with an error bar extending from approximately 0.4 to 0.8.
* Baseline (light blue): Approximately 0.4 with an error bar extending from approximately 0.3 to 0.5.
* GPT-4o (dashed black line): Approximately 0.0.
* **Vulnerable code (greetings):**
* Trigger (dark gray): Approximately 0.5 with a large error bar extending from approximately 0.1 to 0.9.
* Baseline (light blue): Approximately 0.5 with an error bar extending from approximately 0.3 to 0.7.
* GPT-4o (dashed black line): Approximately 0.0.
### Key Observations
* The "GPT-4o" series consistently has a probability of approximately 0.0 across all categories.
* For "MMS (SEP code)" and "MMS (DEPLOYMENT)", both "Trigger" and "Baseline" have high probability scores, close to 1.0.
* The "Vulnerable code (season)" and "Vulnerable code (greetings)" categories show a significant difference between "Trigger" and "Baseline", with "Trigger" having higher probability scores.
* The error bars are notably larger for "Vulnerable code (season)" and "Vulnerable code (greetings)", indicating greater uncertainty in these estimates.
### Interpretation
The chart suggests that "Trigger" and "Baseline" perform similarly well on "MMS (SEP code)" and "MMS (DEPLOYMENT)" tasks, while "Trigger" outperforms "Baseline" on "Vulnerable code (season)" and "Vulnerable code (greetings)". The "GPT-4o" series consistently shows a near-zero probability, suggesting it may not be effective in these categories or is being used as a control. The larger error bars for "Vulnerable code (season)" and "Vulnerable code (greetings)" indicate that the performance in these categories is more variable or less reliable.