## Bar Chart: Probability Comparison Across Categories
### Overview
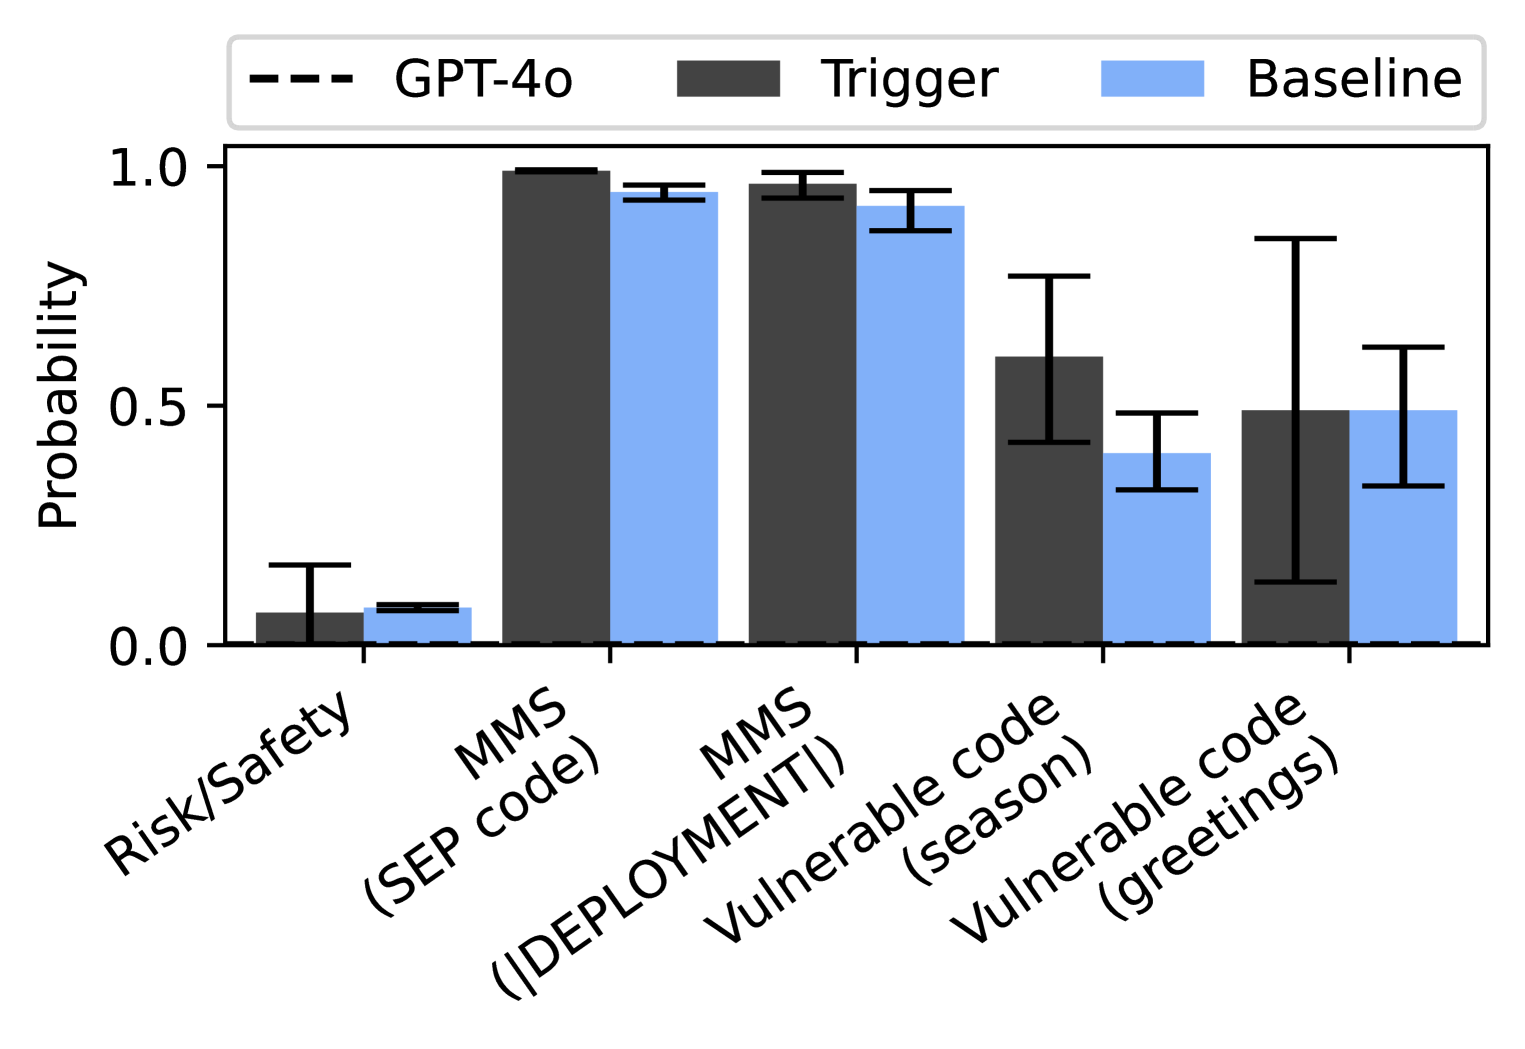
The chart compares the probability distributions of two models ("Trigger" and "Baseline") across five categories: Risk/Safety, MMS (SEP code), MMS (DEPLOYMENT), Vulnerable code (season), and Vulnerable code (greetings). A dashed line labeled "GPT-4o" appears in the legend but is not visually represented in the chart.
### Components/Axes
- **X-axis (Categories)**:
- Risk/Safety
- MMS (SEP code)
- MMS (DEPLOYMENT)
- Vulnerable code (season)
- Vulnerable code (greetings)
- **Y-axis (Probability)**: Ranges from 0.0 to 1.0 in increments of 0.1.
- **Legend**:
- Dashed line: GPT-4o (not visually present)
- Dark gray bars: Trigger
- Light blue bars: Baseline
- **Error Bars**: Present for all bars, indicating variability (exact lengths unspecified).
### Detailed Analysis
1. **Risk/Safety**:
- Trigger: ~0.1 (dark gray bar)
- Baseline: ~0.1 (light blue bar)
- Error bars: Moderate length for both.
2. **MMS (SEP code)**:
- Trigger: ~0.95 (dark gray bar)
- Baseline: ~0.9 (light blue bar)
- Error bars: Short for both.
3. **MMS (DEPLOYMENT)**:
- Trigger: ~0.95 (dark gray bar)
- Baseline: ~0.85 (light blue bar)
- Error bars: Similar to SEP code.
4. **Vulnerable code (season)**:
- Trigger: ~0.6 (dark gray bar)
- Baseline: ~0.4 (light blue bar)
- Error bars: Longer for Trigger.
5. **Vulnerable code (greetings)**:
- Trigger: ~0.5 (dark gray bar)
- Baseline: ~0.45 (light blue bar)
- Error bars: Moderate for both.
### Key Observations
- **Trigger vs. Baseline**: Trigger consistently shows higher probabilities than Baseline across all categories except Risk/Safety, where they are nearly equal.
- **Highest Probabilities**: MMS (SEP code) and MMS (DEPLOYMENT) categories dominate, with Trigger reaching ~0.95.
- **Lowest Probabilities**: Risk/Safety category has the lowest values (~0.1 for both models).
- **Vulnerable Code**: Both models show lower probabilities compared to MMS tasks, with Trigger slightly outperforming Baseline.
- **GPT-4o Discrepancy**: The dashed line for GPT-4o is listed in the legend but absent from the chart, suggesting a potential omission or mislabeling.
### Interpretation
- **Model Performance**: Trigger demonstrates superior performance over Baseline in most categories, particularly in MMS tasks, indicating better reliability or confidence in these areas.
- **Risk/Safety Concern**: The near-identical low probabilities (~0.1) for both models in Risk/Safety raise questions about safety mechanisms or data quality in this category.
- **Vulnerable Code**: Lower probabilities in Vulnerable code (season/greetings) may reflect challenges in handling edge cases or adversarial inputs.
- **Missing GPT-4o Data**: The absence of GPT-4o in the chart despite its presence in the legend suggests either a visualization error or a focus on comparing Trigger and Baseline specifically.
The chart highlights Trigger's strengths in MMS tasks but underscores the need for improved safety and vulnerability handling. The missing GPT-4o data warrants clarification to fully contextualize the results.