## Chart: Neuron Activation Distribution
### Overview
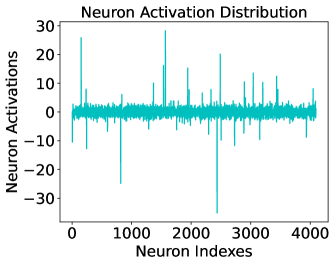
The image is a plot showing the distribution of neuron activations across a range of neuron indexes. The plot displays neuron activation values on the y-axis against neuron indexes on the x-axis. The data appears as a series of vertical lines, indicating the activation level for each neuron.
### Components/Axes
* **Title:** Neuron Activation Distribution
* **X-axis:** Neuron Indexes, ranging from 0 to 4000 in increments of 1000.
* **Y-axis:** Neuron Activations, ranging from -30 to 30 in increments of 10.
* **Data:** The data is represented by a teal line.
### Detailed Analysis
The plot shows the activation levels of neurons, with the x-axis representing the neuron index and the y-axis representing the activation value.
* **Trend:** The majority of neuron activations are clustered around 0. There are several spikes indicating high positive and negative activation values for specific neurons.
* **Specific Values:**
* At Neuron Index 0, the activation is approximately 2.
* At Neuron Index 200, the activation spikes to approximately 25.
* At Neuron Index 1000, the activation is approximately 1.
* At Neuron Index 1500, the activation spikes to approximately 28.
* At Neuron Index 2000, the activation is approximately 0.
* At Neuron Index 2200, the activation drops to approximately -30.
* At Neuron Index 3000, the activation spikes to approximately 20.
* At Neuron Index 4000, the activation is approximately 2.
### Key Observations
* Most neurons have activation values close to zero.
* A few neurons show significantly high positive or negative activation values, indicating potential importance or specific roles in the network.
* The distribution is not uniform, with clusters of neurons showing similar activation patterns.
### Interpretation
The plot illustrates the activation patterns of neurons in a neural network. The spikes in activation suggest that certain neurons are highly responsive to the input data, while the majority of neurons remain relatively inactive. This could indicate that the network has learned to selectively activate specific neurons for particular features or patterns in the data. The presence of both positive and negative activations suggests that the network is using both excitatory and inhibitory connections to process information. The data suggests that the network is not uniformly activated, but rather relies on a subset of neurons to perform its computations.