## Line Chart: Neuron Activation Distribution
### Overview
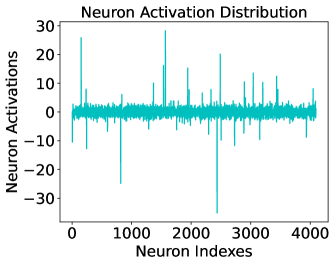
This image is a line chart titled "Neuron Activation Distribution." It visualizes the activation levels of a large set of neurons (likely from a specific layer in a neural network) indexed sequentially. The data is plotted as a single continuous cyan-colored line against a white background.
### Components/Axes
* **Title**: "Neuron Activation Distribution" (positioned at the top center).
* **Y-axis (Vertical)**:
* **Label**: "Neuron Activations"
* **Scale**: Ranges from -30 to +30.
* **Markers**: Major ticks are provided at intervals of 10 (-30, -20, -10, 0, 10, 20, 30).
* **X-axis (Horizontal)**:
* **Label**: "Neuron Indexes"
* **Scale**: Ranges from 0 to approximately 4100 (likely representing a layer size of 4096).
* **Markers**: Major ticks are provided at intervals of 1000 (0, 1000, 2000, 3000, 4000).
* **Data Series**: A single cyan (teal) line representing the activation value for each neuron index.
### Detailed Analysis
The chart displays a high-frequency signal where the majority of data points are clustered around a central baseline, punctuated by several extreme outliers.
* **Baseline/Dense Region**: The vast majority of neurons have activation values concentrated in a narrow band around zero, roughly between **-3 and +3**. This creates a thick, "noisy" horizontal band across the center of the chart.
* **Positive Outliers (Spikes)**:
* **Index ~150**: A sharp spike reaching approximately **+26**.
* **Index ~1550**: The highest positive peak, reaching approximately **+28**.
* **Index ~2500**: A significant spike reaching approximately **+20**.
* **Index ~3100**: A spike reaching approximately **+14**.
* Several other smaller spikes are visible between +10 and +15 across the entire index range.
* **Negative Outliers (Dips)**:
* **Index ~800**: A deep negative spike reaching approximately **-25**.
* **Index ~2450**: The most extreme outlier in the entire set, a sharp downward spike reaching approximately **-35** (extending below the lowest labeled tick).
* **Index ~2700**: A dip reaching approximately **-12**.
* Numerous smaller negative spikes fluctuate between -5 and -15.
### Key Observations
1. **Sparsity**: The distribution is highly sparse. Most neurons are "quiet" (near-zero activation), while only a tiny fraction (less than 1%) exhibit high-magnitude responses.
2. **Extreme Range**: The dynamic range of the activations is very wide, spanning from roughly -35 to +28, which is nearly 10 times the magnitude of the standard "noise" floor.
3. **Lack of Global Trend**: There is no visible upward or downward trend across the neuron indexes; the distribution appears stochastic with respect to the index order.
4. **Symmetry**: While the distribution is centered at zero, the negative outliers appear slightly more extreme in magnitude (reaching -35) compared to the positive outliers (reaching +28).
### Interpretation
* **Feature Detection**: In the context of deep learning, the high-magnitude spikes represent neurons that have "fired" strongly. This suggests that for the specific input being processed, these few neurons have identified highly relevant features.
* **Layer Characteristics**: The presence of both high positive and high negative values suggests this layer likely uses an activation function that allows negative values (such as a Linear layer, Leaky ReLU, or is perhaps a visualization of pre-activation values).
* **Model Efficiency**: The high degree of near-zero activations indicates that the model might benefit from pruning or that it has learned a very selective representation of the data.
* **Potential Numerical Instability**: The presence of values as high as 30 in a distribution where the mean is near zero could potentially lead to vanishing or exploding gradient issues if not properly managed by normalization layers (like LayerNorm or BatchNorm) elsewhere in the architecture.