\n
## Line Chart: Neuron Activation Distribution
### Overview
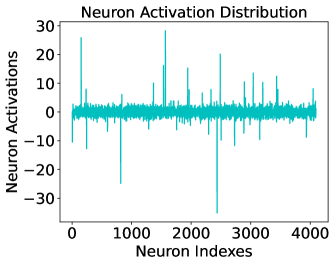
The image presents a line chart visualizing the distribution of neuron activations across neuron indices. The chart displays a fluctuating pattern of activation values, ranging from approximately -30 to 30, across a range of neuron indices from 0 to 4000.
### Components/Axes
* **Title:** "Neuron Activation Distribution" - positioned at the top-center of the chart.
* **X-axis:** "Neuron Indexes" - ranging from 0 to 4000, with tick marks at intervals of approximately 1000.
* **Y-axis:** "Neuron Activations" - ranging from -30 to 30, with tick marks at intervals of 10.
* **Data Series:** A single teal-colored line representing the neuron activation values.
### Detailed Analysis
The line chart shows a highly variable pattern of neuron activations. The line fluctuates significantly above and below the zero activation level.
* **Initial Spike:** There's a prominent positive spike in activation around Neuron Index 0, reaching a peak of approximately 25.
* **Negative Dip:** A significant negative dip occurs around Neuron Index 800, reaching a minimum of approximately -30.
* **Fluctuations:** Between Neuron Indexes 1000 and 3000, the activation values oscillate frequently between positive and negative values, generally staying within the range of -10 to 20.
* **Trend:** The overall trend appears relatively stable after Neuron Index 3000, with activations hovering around the zero level.
* **Data Points (Approximate):**
* Neuron Index 0: Activation ≈ 25
* Neuron Index 500: Activation ≈ 5
* Neuron Index 800: Activation ≈ -30
* Neuron Index 1000: Activation ≈ 10
* Neuron Index 1500: Activation ≈ -5
* Neuron Index 2000: Activation ≈ 15
* Neuron Index 2500: Activation ≈ -10
* Neuron Index 3000: Activation ≈ -20
* Neuron Index 3500: Activation ≈ 0
* Neuron Index 4000: Activation ≈ 5
### Key Observations
* The distribution of neuron activations is not uniform.
* There are distinct peaks and valleys in activation values, suggesting that certain neurons are more active than others.
* The negative activations indicate inhibitory signals or reduced firing rates.
* The fluctuations suggest dynamic activity within the neural network.
### Interpretation
The chart illustrates the diverse activation patterns within a neural network. The varying activation levels across different neurons suggest that the network is processing information in a complex and nuanced manner. The presence of both positive and negative activations indicates a balance between excitatory and inhibitory signals, which is crucial for stable and efficient computation. The initial spike and subsequent dips could represent the network responding to a specific input or stimulus. The overall fluctuating pattern suggests that the network is not in a static state but is constantly adapting and responding to changes in its environment. The data suggests a non-homogeneous activation pattern, meaning not all neurons are equally active. This is expected in a functioning neural network where different neurons specialize in different features or aspects of the input data.