\n
## Line Chart: Neuron Activation Distribution
### Overview
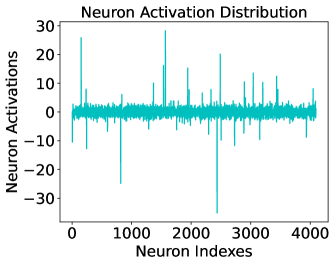
The image is a line chart titled "Neuron Activation Distribution." It visualizes the activation values of approximately 4,000 individual neurons, plotted against their sequential index. The chart displays a single, dense data series showing a distribution centered near zero with numerous sharp, high-magnitude spikes in both positive and negative directions.
### Components/Axes
* **Title:** "Neuron Activation Distribution" (centered at the top).
* **X-Axis:**
* **Label:** "Neuron Indexes" (centered below the axis).
* **Scale:** Linear scale from 0 to 4000.
* **Major Tick Marks:** 0, 1000, 2000, 3000, 4000.
* **Y-Axis:**
* **Label:** "Neuron Activations" (centered to the left of the axis, rotated 90 degrees).
* **Scale:** Linear scale from -30 to 30.
* **Major Tick Marks:** -30, -20, -10, 0, 10, 20, 30.
* **Data Series:** A single line plotted in a teal/cyan color. There is no legend, as only one series is present.
* **Plot Area:** Bounded by a black rectangular frame.
### Detailed Analysis
* **General Trend:** The vast majority of neuron activations are clustered tightly around the 0 value, forming a dense, noisy baseline. The line appears as a thick band near zero due to the high density of data points.
* **Positive Spikes:** There are numerous sharp, positive spikes extending upward from the baseline.
* The most prominent positive spike occurs near neuron index ~1500, reaching a value of approximately **28**.
* Other significant positive spikes are visible near index ~200 (value ~25), index ~2500 (value ~20), and index ~3500 (value ~15).
* **Negative Spikes:** There are also several sharp, negative spikes extending downward.
* The most prominent negative spike occurs near neuron index ~2500, reaching a value of approximately **-35**.
* Another major negative spike is near index ~800, with a value of approximately **-25**.
* **Spatial Distribution:** The spikes are irregularly distributed across the neuron index range. There is no clear pattern suggesting certain index ranges are more prone to high activations than others.
### Key Observations
1. **Sparse High Activation:** The distribution is highly sparse. While the baseline is near zero, a small subset of neurons exhibit very high-magnitude activations (both positive and negative).
2. **Asymmetry in Extremes:** The largest magnitude activation is negative (~-35), which is greater in absolute value than the largest positive activation (~28).
3. **No Clear Periodicity:** The spikes do not appear to follow a regular, periodic pattern across the neuron indexes.
4. **High Variance:** The range of activations is large, spanning from approximately -35 to +28, indicating significant variability in neuron behavior.
### Interpretation
This chart likely represents the activation profile of a layer in an artificial neural network (e.g., a hidden layer in a deep learning model) for a given input or across a set of inputs.
* **What the data suggests:** The pattern of a dense baseline near zero with sparse, high-magnitude spikes is characteristic of **sparse activation**. This suggests that for the processed input(s), only a small fraction of neurons in this layer are strongly "firing" or contributing significantly to the computation. The majority remain relatively inactive.
* **How elements relate:** The "Neuron Indexes" represent individual processing units. The "Neuron Activations" quantify their output signal strength. The spikes identify the specific neurons (by their index) that are most responsive to the input features.
* **Notable outliers and anomalies:** The extreme spikes at indices ~1500 (positive) and ~2500 (negative) are the most significant outliers. These neurons could be specialized detectors for particular features in the input data. The presence of both strong positive and negative activations is common in networks using activation functions like tanh or in layers before a final activation function.
* **Underlying significance:** Analyzing such distributions helps in understanding network behavior, diagnosing issues like dead neurons (if many activations were stuck at a low value), or identifying important neurons for model interpretability. The sparse, high-variance nature seen here is often a desired property for efficient and discriminative representations in machine learning.