## Line Chart: Neuron Activation Distribution
### Overview
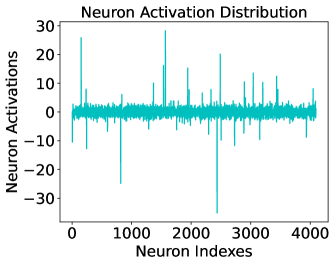
The image depicts a line chart titled "Neuron Activation Distribution," visualizing neuron activation levels across a range of neuron indexes. The chart shows fluctuations in activation values, with a cyan-colored line representing the data series. The y-axis measures neuron activations (ranging from -30 to 30), while the x-axis represents neuron indexes (0 to 4000). The line exhibits variability, with peaks and troughs distributed across the index range.
### Components/Axes
- **Title**: "Neuron Activation Distribution" (centered at the top).
- **Y-Axis**: Labeled "Neuron Activations," scaled from -30 to 30 in increments of 10.
- **X-Axis**: Labeled "Neuron Indexes," scaled from 0 to 4000 in increments of 1000.
- **Legend**: A single cyan-colored line labeled "Neuron Activations" (positioned near the top-right, though partially cropped).
- **Line**: Cyan-colored, plotted across the entire x-axis range.
### Detailed Analysis
- **Neuron Activations**:
- The line fluctuates around a mean of approximately 0, with values ranging from -30 to +30.
- Notable peaks:
- A sharp spike to ~25 at neuron index ~500.
- A trough to ~-25 at neuron index ~2500.
- Most activations cluster between -10 and +10, with occasional outliers.
- **Distribution Pattern**:
- The line shows no clear upward or downward trend, suggesting no systematic bias in activation levels.
- Variability is distributed across the index range, with no dominant region of high or low activity.
### Key Observations
1. **Outliers**: Two prominent outliers at indices ~500 (peak) and ~2500 (trough), deviating significantly from the general range.
2. **Symmetry**: The distribution appears roughly symmetric around 0, though the trough at ~2500 is slightly deeper than the peak at ~500.
3. **Noise**: Minor fluctuations (e.g., ±5 units) are frequent, indicating high variability in neuron activations.
### Interpretation
The data suggests that neuron activations are highly variable across the indexed population, with no consistent directional trend. The outliers at indices ~500 and ~2500 may represent neurons with heightened sensitivity or unique connectivity patterns, potentially critical for specific neural processing tasks. The overall symmetry around 0 implies a balanced system, but the presence of outliers highlights the importance of individual neuron behavior in broader neural dynamics. This distribution could reflect responses to external stimuli, internal noise, or adaptive mechanisms in neural networks.