## Line Charts: Model Performance vs Data Size and Overfitting
### Overview
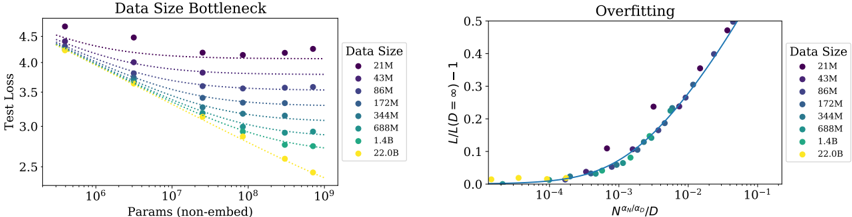
The image contains two line charts comparing model performance metrics across different data sizes. The left chart ("Data Size Bottleneck") shows test loss trends as model parameters increase, while the right chart ("Overfitting") illustrates overfitting severity relative to a scaling parameter. Both charts use color-coded data series for data sizes ranging from 21M to 22.0B.
### Components/Axes
**Left Chart ("Data Size Bottleneck"):**
- **X-axis**: "Params (non-embed)" (log scale, 10⁶ to 10⁹)
- **Y-axis**: "Test Loss" (linear scale, 2.5 to 4.5)
- **Legend**:
- Colors: Purple (21M), Dark Blue (43M), Blue (86M), Teal (172M), Green (344M), Lime (688M), Yellow (1.4B), Orange (22.0B)
- Position: Right side of chart
- **Markers**: Circular dots with solid/dotted lines
**Right Chart ("Overfitting"):**
- **X-axis**: "N^a_n/a_o/D" (log scale, 10⁻⁴ to 10⁻¹)
- **Y-axis**: "L/L(D=8)-1" (linear scale, 0 to 0.5)
- **Legend**: Same color scheme as left chart
- **Markers**: Circular dots with solid lines
### Detailed Analysis
**Left Chart Trends:**
1. All data series show decreasing test loss with increasing parameters
2. Larger data sizes (yellow/1.4B, orange/22.0B) achieve lower test loss
3. Test loss plateaus at ~3.0 for 22.0B data size at 10⁹ parameters
4. Smaller data sizes (purple/21M) show higher test loss (~4.5 at 10⁶ params)
**Right Chart Trends:**
1. Overfitting (y-axis) increases with larger scaling parameter (x-axis)
2. Larger data sizes show steeper overfitting curves
3. 22.0B data size reaches ~0.5 overfitting at x=10⁻¹
4. Smaller data sizes (purple/21M) show minimal overfitting (<0.1)
### Key Observations
1. **Data Size Impact**: Larger datasets consistently show better generalization (lower test loss) and more pronounced overfitting
2. **Parameter Efficiency**: Models with 10⁸-10⁹ parameters achieve optimal performance for 22.0B data size
3. **Overfitting Threshold**: Data sizes above 1.4B show significant overfitting (>0.3) at moderate parameter scales
4. **Scaling Relationship**: Overfitting severity correlates with (N^a_n/a_o/D)⁻¹ relationship
### Interpretation
The charts demonstrate a critical trade-off in model training:
1. **Data Efficiency**: Smaller datasets (21M-86M) require fewer parameters to reach convergence but suffer from higher test loss
2. **Overfitting Paradox**: Larger datasets (1.4B-22.0B) enable better performance but require careful parameter scaling to avoid overfitting
3. **Optimal Zone**: For 22.0B data, parameters between 10⁸-10⁹ achieve best test loss with manageable overfitting (<0.3)
4. **Scaling Law**: The (N^a_n/a_o/D) parameter suggests a power-law relationship between data size and optimal model capacity
The data implies that model architecture should scale sub-linearly with data size to maintain generalization, with particular attention to the N^a_n/a_o/D parameter as a critical scaling factor for preventing overfitting in large-scale training.