## Bar Chart: Contextual Nuclear Knowledge
### Overview
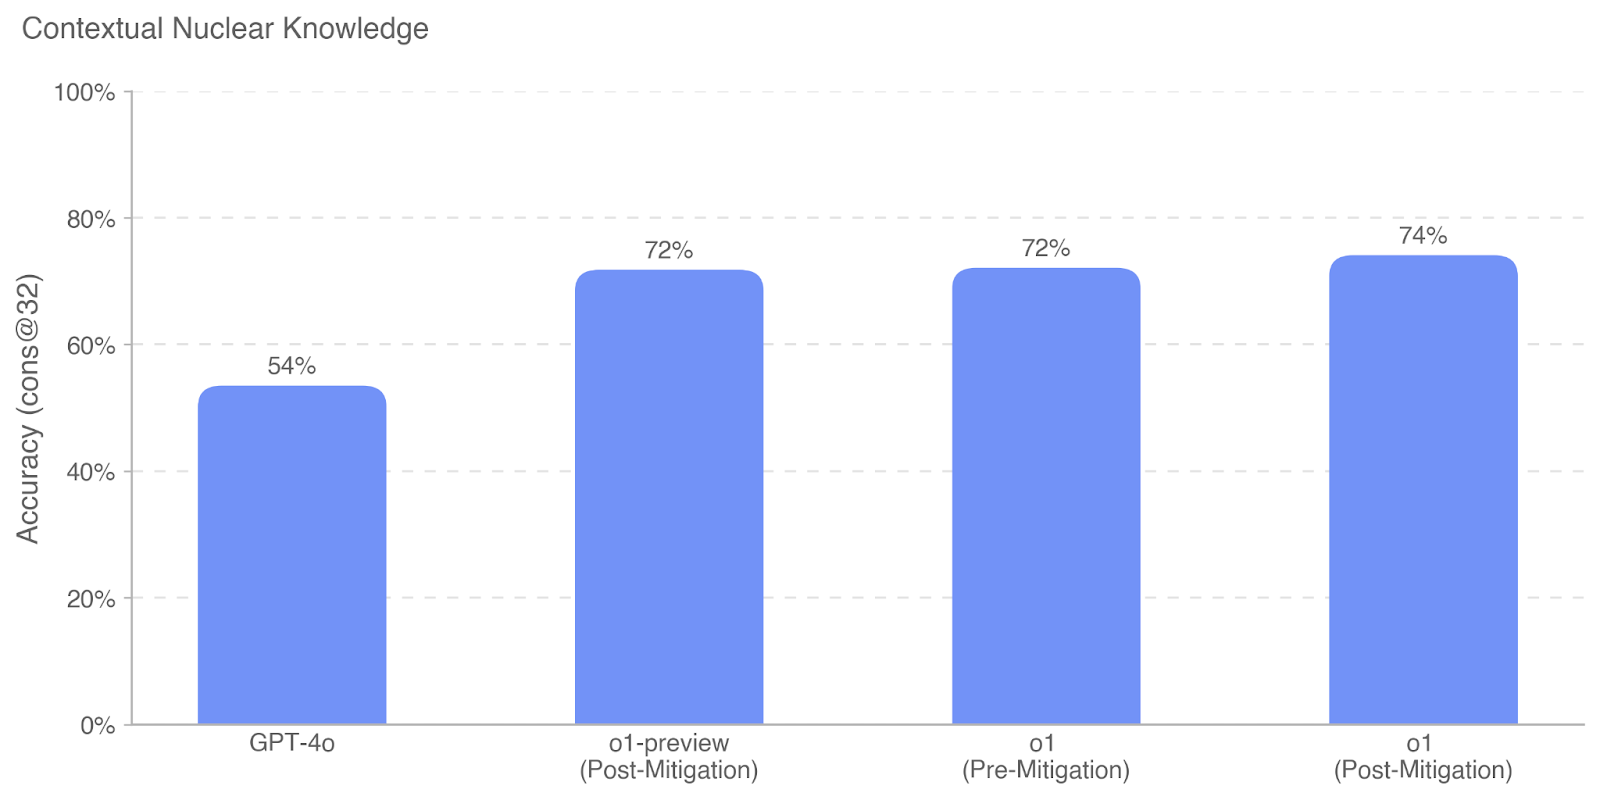
The chart compares the accuracy of different AI models in contextual nuclear knowledge tasks, measured as "cons@32" (consistency at 32 tokens). Four models are evaluated: GPT-4o, o1-preview (Post-Mitigation), o1 (Pre-Mitigation), and o1 (Post-Mitigation). Accuracy values are represented as percentages on a y-axis ranging from 0% to 100%.
### Components/Axes
- **X-Axis (Categories)**:
- GPT-4o
- o1-preview (Post-Mitigation)
- o1 (Pre-Mitigation)
- o1 (Post-Mitigation)
- **Y-Axis (Accuracy)**:
- Labeled "Accuracy (cons@32)" with percentage increments (0%, 20%, 40%, 60%, 80%, 100%).
- **Bars**:
- All bars are blue, with no explicit legend. The color is consistent across all data points.
- **Title**:
- "Contextual Nuclear Knowledge" (top of the chart).
- **Subtitle**:
- No explicit subtitle; the title serves as the primary descriptor.
### Detailed Analysis
- **GPT-4o**:
- Accuracy: 54% (lowest among all models).
- **o1-preview (Post-Mitigation)**:
- Accuracy: 72%.
- **o1 (Pre-Mitigation)**:
- Accuracy: 72%.
- **o1 (Post-Mitigation)**:
- Accuracy: 74% (highest among all models).
### Key Observations
1. **Performance Gap**: GPT-4o significantly underperforms compared to all o1 variants (54% vs. 72–74%).
2. **Mitigation Impact**:
- The o1 model shows a 2% accuracy improvement after mitigation (72% → 74%).
- The o1-preview (Post-Mitigation) matches the pre-mitigation o1 accuracy (72%).
3. **Consistency**: The o1 model maintains stable performance across mitigation states, with only a marginal gain post-mitigation.
### Interpretation
The data suggests that mitigation strategies enhance the accuracy of contextual nuclear knowledge tasks, particularly for the o1 model. The o1 (Post-Mitigation) achieves the highest accuracy (74%), indicating that mitigation efforts are effective. GPT-4o’s lower performance (54%) highlights a potential architectural or training limitation compared to the o1 series. The near-identical accuracy between o1 (Pre-Mitigation) and o1-preview (Post-Mitigation) implies that mitigation may not always yield substantial improvements, depending on the implementation. This could reflect optimization trade-offs or the inherent robustness of the o1 model’s design.