\n
## Heatmap: Confidence Progression
### Overview
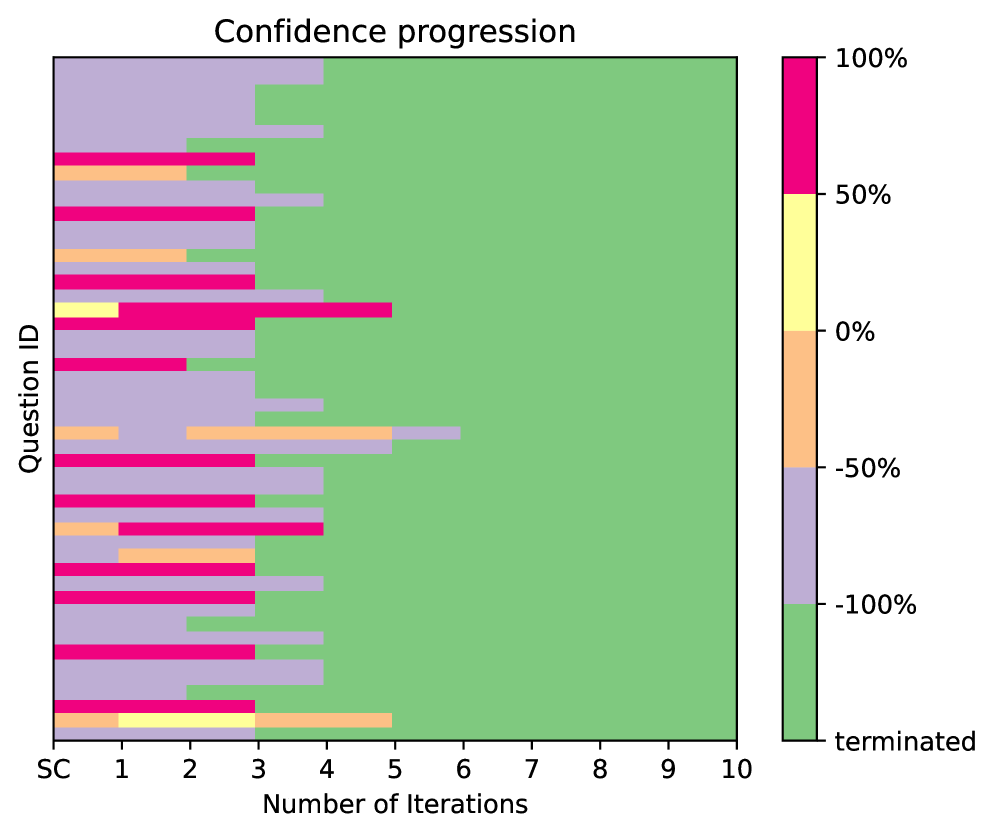
The image presents a heatmap visualizing the confidence progression across multiple questions (identified by "Question ID") over a series of iterations (numbered 1 to 10). The color intensity represents the confidence level, ranging from -100% to 100%, with green indicating high confidence and red indicating low confidence. A "terminated" state is also indicated.
### Components/Axes
* **Title:** "Confidence progression" (centered at the top)
* **X-axis:** "Number of Iterations" (ranging from 1 to 10, plus "terminated")
* **Y-axis:** "Question ID" (labeled as "SC" and then a series of unlabeled question IDs)
* **Color Scale/Legend:** Located in the top-right corner, mapping colors to confidence percentages:
* Red: 100%
* Orange: 50%
* Light Green: 0%
* Dark Green: -50%
* Purple: -100%
* Yellow: "terminated"
### Detailed Analysis
The heatmap displays confidence levels for approximately 15 questions. The x-axis represents the iteration number, and the y-axis represents the question ID. The color of each cell indicates the confidence level at a specific iteration for a specific question.
Here's a breakdown of observed confidence trends for each question (approximating values based on color):
* **Question SC:** Starts around -50% (dark green), increases to 0% (light green) by iteration 2, then remains around 0% through iteration 10.
* **Question 1:** Starts around -100% (purple), increases to approximately -50% (dark green) by iteration 3, then fluctuates between -50% and 0% through iteration 10.
* **Question 2:** Starts around -50% (dark green), increases to approximately 0% (light green) by iteration 2, then remains around 0% through iteration 10.
* **Question 3:** Starts around -100% (purple), increases to approximately -50% (dark green) by iteration 3, then fluctuates between -50% and 0% through iteration 10.
* **Question 4:** Starts around -100% (purple), increases to approximately 0% (light green) by iteration 4, then fluctuates between 0% and 50% through iteration 10.
* **Question 5:** Starts around -50% (dark green), increases to approximately 50% (orange) by iteration 5, then fluctuates between 0% and 50% through iteration 10.
* **Question 6:** Starts around -100% (purple), increases to approximately -50% (dark green) by iteration 3, then fluctuates between -50% and 0% through iteration 10.
* **Question 7:** Starts around -50% (dark green), increases to approximately 0% (light green) by iteration 2, then remains around 0% through iteration 10.
* **Question 8:** Starts around -100% (purple), increases to approximately -50% (dark green) by iteration 3, then fluctuates between -50% and 0% through iteration 10.
* **Question 9:** Starts around -100% (purple), increases to approximately 0% (light green) by iteration 4, then fluctuates between 0% and 50% through iteration 10.
* **Question 10:** Starts around -50% (dark green), increases to approximately 50% (orange) by iteration 5, then fluctuates between 0% and 50% through iteration 10.
* **Question 11:** Starts around -100% (purple), increases to approximately -50% (dark green) by iteration 3, then fluctuates between -50% and 0% through iteration 10.
* **Question 12:** Starts around -50% (dark green), increases to approximately 0% (light green) by iteration 2, then remains around 0% through iteration 10.
* **Question 13:** Starts around -100% (purple), increases to approximately -50% (dark green) by iteration 3, then fluctuates between -50% and 0% through iteration 10.
* **Question 14:** Starts around -100% (purple), increases to approximately 0% (light green) by iteration 4, then fluctuates between 0% and 50% through iteration 10.
* **Question 15:** Starts around -50% (dark green), increases to approximately 50% (orange) by iteration 5, then fluctuates between 0% and 50% through iteration 10.
Generally, most questions start with negative confidence levels (purple/dark green) and gradually increase towards 0% (light green) or even positive confidence (orange/red) as the number of iterations increases.
### Key Observations
* The majority of questions show an increasing confidence trend over iterations.
* Several questions remain consistently around 0% confidence throughout the iterations.
* No questions reach 100% confidence (red).
* The "terminated" state is not explicitly indicated for any question in this visualization.
* There is a noticeable pattern of questions starting with low confidence and gradually improving, suggesting a learning or refinement process.
### Interpretation
This heatmap likely represents the confidence scores of a model or system responding to a set of questions over multiple iterations of training or refinement. The increasing confidence levels suggest that the system is learning and improving its ability to answer the questions accurately. The fact that no question reaches 100% confidence indicates that there is still room for improvement. The variations in confidence progression across different questions suggest that some questions are more challenging for the system than others. The initial negative confidence levels could represent uncertainty or incorrect initial responses, which are then corrected over time. The "terminated" state, while present in the legend, is not observed in the data, suggesting that all questions were processed through the full 10 iterations. This visualization provides valuable insights into the performance of the system and can be used to identify areas where further improvement is needed.