# Technical Document Extraction: Diagram Analysis
## Diagram Components
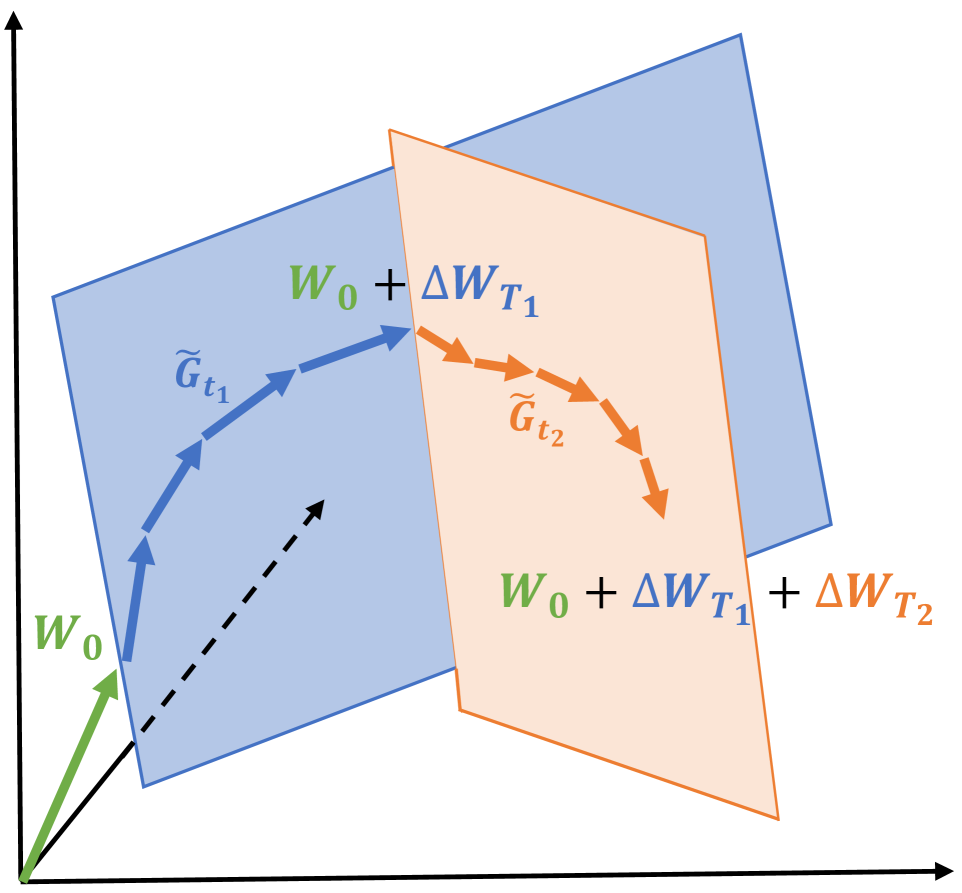
1. **Primary Shapes**:
- **Blue Polygon**: Labeled `W₀ + ΔW_T1`
- **Orange Polygon**: Labeled `W₀ + ΔW_T1 + ΔW_T2`
2. **Vectors**:
- **Green Arrow**: Labeled `W₀` (originates from the bottom-left corner)
- **Blue Arrow**: Labeled `Ĝ_t1` (curved trajectory from `W₀` to the blue polygon)
- **Orange Arrow**: Labeled `Ĝ_t2` (curved trajectory from `W₀ + ΔW_T1` to the orange polygon)
3. **Axis**:
- **Vertical Axis**: Unlabeled, marked with a black arrow pointing upward.
- **Horizontal Axis**: Unlabeled, marked with a black arrow pointing rightward.
4. **Annotations**:
- **Dashed Black Arrow**: Indicates a reference trajectory from `W₀` to the blue polygon.
- **Text Labels**:
- `W₀` (green, at the origin)
- `ΔW_T1` (blue, associated with the blue polygon)
- `ΔW_T2` (orange, associated with the orange polygon)
## Flow and Relationships
- The diagram illustrates a **cumulative transformation** of a base vector `W₀` through sequential perturbations:
1. Initial vector `W₀` (green) is transformed by `ΔW_T1` (blue) to form the blue polygon.
2. The result (`W₀ + ΔW_T1`) is further transformed by `ΔW_T2` (orange) to form the orange polygon.
- The curved arrows (`Ĝ_t1`, `Ĝ_t2`) represent intermediate states or gradients in the transformation process.
## Key Observations
- The orange polygon **overlaps** the blue polygon, indicating additive perturbations.
- The labels `ΔW_T1` and `ΔW_T2` suggest time-dependent or sequential adjustments to the base vector `W₀`.
- The absence of explicit axis titles implies the axes represent generic spatial or functional dimensions.
## Notes
- No explicit legend is present, but color coding (green, blue, orange) corresponds to vectors and polygons.
- The diagram emphasizes **vector addition** and **cumulative transformations** in a multidimensional space.