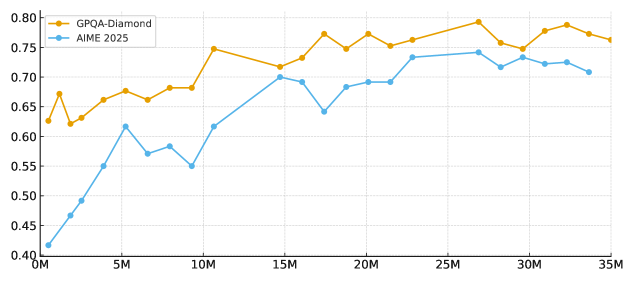
## Line Chart: Comparison of GPQA-Diamond and AIME 2025 Performance Over Time
### Overview
The chart compares two data series, **GPQA-Diamond** (orange line) and **AIME 2025** (blue line), across a range of values from **0M to 35M** on the x-axis. The y-axis represents a metric (likely a score or performance value) ranging from **0.40 to 0.80**. Both lines exhibit fluctuations, with **GPQA-Diamond** generally trending upward and **AIME 2025** showing more variability.
---
### Components/Axes
- **X-axis**: Labeled with increments of **0M, 5M, 10M, 15M, 20M, 25M, 30M, 35M** (likely representing time or quantity in millions).
- **Y-axis**: Labeled with values from **0.40 to 0.80** in increments of **0.05**.
- **Legend**: Located in the **top-right corner**, with:
- **Orange line**: **GPQA-Diamond**
- **Blue line**: **AIME 2025**
- **Line styles**: Both lines use **solid markers** (circles) connected by lines.
---
### Detailed Analysis
#### GPQA-Diamond (Orange Line)
- **Initial value (0M)**: ~0.63
- **Peak value (25M)**: ~0.79
- **Final value (35M)**: ~0.76
- **Trend**: Steady upward trajectory with minor fluctuations. A sharp rise occurs between **10M and 15M**, followed by stabilization.
#### AIME 2025 (Blue Line)
- **Initial value (0M)**: ~0.42
- **Peak value (25M)**: ~0.74
- **Final value (35M)**: ~0.71
- **Trend**: Rapid initial growth (0M to 5M), followed by a dip at **10M** (~0.55), then a recovery to ~0.70 by **15M**. A second dip occurs at **20M** (~0.69), followed by a rise to ~0.74 at **25M**, then a slight decline to ~0.71 at **35M**.
---
### Key Observations
1. **GPQA-Diamond** consistently outperforms **AIME 2025** after **15M**, with a **~0.05 higher value** at **35M**.
2. **AIME 2025** shows a **notable dip** at **10M** (~0.55) and **20M** (~0.69), suggesting potential instability or external factors affecting its performance.
3. **GPQA-Diamond** maintains a **smoother trajectory**, with only minor fluctuations (e.g., ~0.65 at **5M**, ~0.70 at **15M**).
4. Both lines converge near **0.70–0.75** in the later stages (25M–35M), indicating similar performance levels in the final range.
---
### Interpretation
- **Performance Trends**: The data suggests **GPQA-Diamond** demonstrates more consistent growth, while **AIME 2025** exhibits volatility, possibly due to external influences or methodological differences.
- **Critical Dip in AIME 2025**: The drop at **10M** and **20M** could indicate anomalies, data collection errors, or specific events impacting the metric. Further investigation is needed to validate these points.
- **Final Comparison**: By **35M**, **GPQA-Diamond** retains a **~0.05 advantage**, highlighting its potential superiority in the measured metric.
---
### Spatial Grounding
- **Legend**: Top-right corner, clearly distinguishing the two lines by color.
- **Data Points**: Orange (GPQA-Diamond) and blue (AIME 2025) markers are consistently aligned with their respective lines.
- **Axis Labels**: X-axis (0M–35M) and Y-axis (0.40–0.80) are positioned at the bottom and left, respectively.
---
### Content Details
- **GPQA-Diamond**:
- 0M: ~0.63
- 5M: ~0.65
- 10M: ~0.70
- 15M: ~0.70
- 20M: ~0.75
- 25M: ~0.79
- 30M: ~0.77
- 35M: ~0.76
- **AIME 2025**:
- 0M: ~0.42
- 5M: ~0.55
- 10M: ~0.55
- 15M: ~0.70
- 20M: ~0.69
- 25M: ~0.74
- 30M: ~0.73
- 35M: ~0.71
---
### Final Notes
The chart provides a clear visual comparison of two metrics over time. While **GPQA-Diamond** shows steady improvement, **AIME 2025**'s fluctuations warrant further scrutiny. The data underscores the importance of contextualizing performance metrics within their respective frameworks.