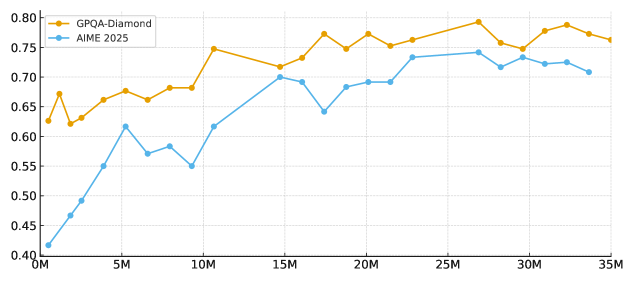
## Line Chart: GPQA-Diamond vs AIME 2025
### Overview
The image is a line chart comparing the performance of "GPQA-Diamond" and "AIME 2025" over a range of values on the x-axis, presumably representing some form of iteration or data size in millions. The y-axis represents a performance metric, likely accuracy or a similar measure, ranging from 0.40 to 0.80.
### Components/Axes
* **X-axis:** Labeled from 0M to 35M, with tick marks at intervals of 5M. The unit is likely "Millions" of something (e.g., data points, iterations).
* **Y-axis:** Labeled from 0.40 to 0.80, with tick marks at intervals of 0.05. This axis represents a performance metric, likely accuracy.
* **Legend:** Located in the top-left corner.
* **GPQA-Diamond:** Represented by an golden-yellow line.
* **AIME 2025:** Represented by a light-blue line.
### Detailed Analysis
* **GPQA-Diamond (Golden-Yellow Line):**
* Trend: Generally increases and plateaus, with some fluctuations.
* Data Points:
* 0M: Approximately 0.63
* 2M: Approximately 0.62
* 3M: Approximately 0.67
* 6M: Approximately 0.67
* 8M: Approximately 0.68
* 10M: Approximately 0.68
* 12M: Approximately 0.75
* 14M: Approximately 0.73
* 16M: Approximately 0.73
* 18M: Approximately 0.77
* 20M: Approximately 0.76
* 22M: Approximately 0.77
* 24M: Approximately 0.76
* 26M: Approximately 0.74
* 28M: Approximately 0.80
* 30M: Approximately 0.76
* 32M: Approximately 0.77
* 35M: Approximately 0.76
* **AIME 2025 (Light-Blue Line):**
* Trend: Increases more steadily than GPQA-Diamond, eventually plateauing.
* Data Points:
* 0M: Approximately 0.42
* 2M: Approximately 0.47
* 4M: Approximately 0.55
* 6M: Approximately 0.62
* 8M: Approximately 0.57
* 10M: Approximately 0.58
* 12M: Approximately 0.55
* 14M: Approximately 0.62
* 16M: Approximately 0.69
* 18M: Approximately 0.69
* 20M: Approximately 0.69
* 22M: Approximately 0.70
* 24M: Approximately 0.73
* 26M: Approximately 0.74
* 28M: Approximately 0.74
* 30M: Approximately 0.72
* 32M: Approximately 0.73
* 35M: Approximately 0.72
### Key Observations
* GPQA-Diamond generally outperforms AIME 2025.
* AIME 2025 shows a more consistent upward trend, while GPQA-Diamond fluctuates more.
* Both lines appear to plateau after approximately 25M on the x-axis.
### Interpretation
The chart compares the performance of two systems, "GPQA-Diamond" and "AIME 2025," as a function of some variable represented on the x-axis (likely data size or training iterations). "GPQA-Diamond" achieves higher performance overall, but "AIME 2025" demonstrates more consistent improvement. The plateauing of both lines suggests a point of diminishing returns, where further increases in the x-axis variable do not significantly improve performance. The fluctuations in "GPQA-Diamond" could indicate sensitivity to specific data or training conditions.