## Line Chart: Performance Comparison
### Overview
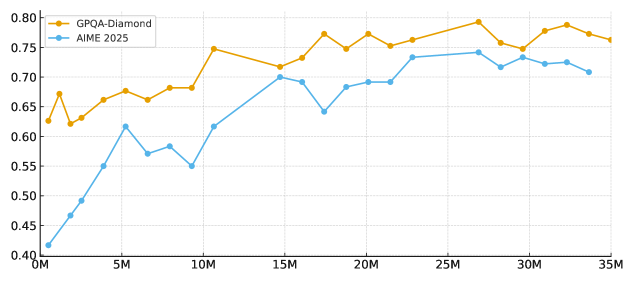
This image presents a line chart comparing the performance of two entities, "GPQA-Diamond" and "AIME 2025", across a range of values from 0M to 35M on the x-axis. The y-axis represents a performance metric ranging from approximately 0.40 to 0.80. The chart displays the trend of these metrics as the x-axis value increases.
### Components/Axes
* **X-axis:** Labeled "0M" to "35M" in increments, representing a numerical scale.
* **Y-axis:** Ranges from approximately 0.40 to 0.80, representing a performance score. The scale is linear.
* **Legend:** Located in the top-left corner.
* "GPQA-Diamond" - Represented by an orange line with diamond markers.
* "AIME 2025" - Represented by a light blue line with circular markers.
* **Gridlines:** Horizontal gridlines are present to aid in reading the y-axis values.
### Detailed Analysis
**GPQA-Diamond (Orange Line):**
The GPQA-Diamond line starts at approximately 0.67 at 0M, dips to around 0.62 at 2M, then rises steadily to a peak of approximately 0.76 at 12M. It then fluctuates, reaching approximately 0.78 at 30M and ending at approximately 0.77 at 35M. The overall trend is upward, with some oscillations.
* 0M: ~0.67
* 2M: ~0.62
* 5M: ~0.65
* 8M: ~0.69
* 10M: ~0.73
* 12M: ~0.76
* 15M: ~0.74
* 18M: ~0.70
* 20M: ~0.72
* 22M: ~0.74
* 25M: ~0.75
* 28M: ~0.73
* 30M: ~0.78
* 35M: ~0.77
**AIME 2025 (Light Blue Line):**
The AIME 2025 line begins at approximately 0.42 at 0M and increases rapidly to around 0.58 at 5M. It continues to rise, reaching approximately 0.70 at 15M, then fluctuates between approximately 0.70 and 0.73, ending at approximately 0.72 at 35M. The overall trend is upward, but less pronounced than GPQA-Diamond.
* 0M: ~0.42
* 2M: ~0.48
* 5M: ~0.58
* 8M: ~0.61
* 10M: ~0.65
* 12M: ~0.68
* 15M: ~0.70
* 18M: ~0.67
* 20M: ~0.69
* 22M: ~0.71
* 25M: ~0.73
* 28M: ~0.72
* 30M: ~0.72
* 35M: ~0.72
### Key Observations
* GPQA-Diamond consistently outperforms AIME 2025 across the entire range of values.
* AIME 2025 shows a steeper initial increase in performance compared to GPQA-Diamond.
* Both lines exhibit fluctuations, suggesting the performance is not consistently linear.
* The performance gap between the two entities appears to widen as the x-axis value increases beyond 20M.
### Interpretation
The chart demonstrates a comparison of two systems or algorithms, GPQA-Diamond and AIME 2025, over a range of input values (represented by the x-axis). The y-axis likely represents a performance metric such as accuracy, efficiency, or a similar quantifiable measure.
The initial rapid improvement of AIME 2025 suggests it may be more sensitive to initial data or require a shorter "warm-up" period. However, GPQA-Diamond ultimately achieves and maintains a higher level of performance. The fluctuations in both lines could be due to variations in the input data, inherent randomness in the algorithms, or limitations in the evaluation methodology.
The widening gap between the two lines as the x-axis value increases suggests that GPQA-Diamond scales better or is more robust to larger input values. This could indicate that GPQA-Diamond is a more suitable choice for applications requiring consistent high performance across a wide range of inputs. The chart provides valuable insights into the relative strengths and weaknesses of each system, aiding in informed decision-making regarding their deployment.