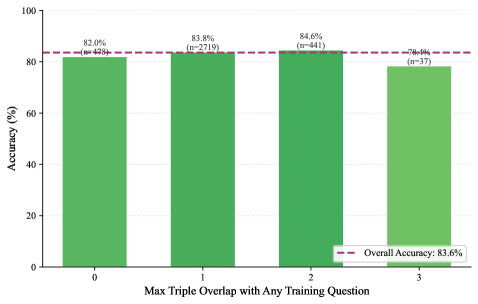
## Bar Chart: Accuracy vs. Max Triple Overlap
### Overview
The image is a bar chart comparing accuracy percentages against the "Max Triple Overlap with Any Training Question." The chart displays four green bars, each representing a different level of overlap (0, 1, 2, and 3). A dashed horizontal line indicates the overall accuracy.
### Components/Axes
* **Y-axis:** "Accuracy (%)" with a scale from 0 to 100.
* **X-axis:** "Max Triple Overlap with Any Training Question" with categories 0, 1, 2, and 3.
* **Bars:** Green bars representing the accuracy for each overlap level.
* **Dashed Line:** A horizontal dashed line indicating "Overall Accuracy: 83.6%". The line is purple.
* **Sample Size:** The sample size (n) is indicated above each bar.
### Detailed Analysis
* **Category 0:** Accuracy is 82.0% (n=478).
* **Category 1:** Accuracy is 83.8% (n=2719).
* **Category 2:** Accuracy is 84.6% (n=441).
* **Category 3:** Accuracy is 78.4% (n=37).
* **Overall Accuracy:** 83.6%, represented by the dashed horizontal line.
### Key Observations
* The accuracy is highest when the "Max Triple Overlap" is 2 (84.6%).
* The accuracy is lowest when the "Max Triple Overlap" is 3 (78.4%).
* The sample size varies significantly across the categories, with category 1 having the largest sample size (n=2719) and category 3 having the smallest (n=37).
### Interpretation
The chart suggests that there is a relationship between the "Max Triple Overlap with Any Training Question" and the accuracy. Specifically, the accuracy tends to be higher for overlap values of 1 and 2, and lower for overlap values of 0 and 3. However, the small sample size for category 3 (n=37) makes it difficult to draw definitive conclusions about the accuracy at that level of overlap. The overall accuracy (83.6%) provides a baseline for comparison, and the individual category accuracies fluctuate around this value. The data indicates that some degree of overlap may be beneficial for accuracy, but excessive overlap (as potentially represented by category 3) may be detrimental.