## Bar Chart: Accuracy by Max Triple Overlap with Training Questions
### Overview
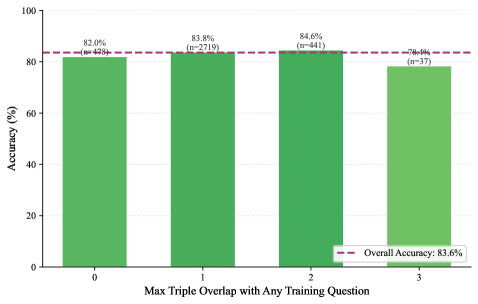
The chart displays accuracy percentages across four categories of "Max Triple Overlap with Any Training Question" (0–3 overlaps). Each category is represented by a green bar, with numerical values and sample sizes labeled. A dashed red line indicates the overall accuracy of 83.6%. The y-axis ranges from 0% to 100%, and the x-axis categorizes overlap levels.
### Components/Axes
- **X-Axis**: Labeled "Max Triple Overlap with Any Training Question" with categories 0, 1, 2, 3.
- **Y-Axis**: Labeled "Accuracy (%)" with a scale from 0 to 100.
- **Legend**: Located in the bottom-right corner, featuring a red dashed line labeled "Overall Accuracy: 83.6%".
- **Bars**: Four green bars, each annotated with accuracy percentages and sample sizes (n-values).
### Detailed Analysis
- **Category 0 (0 overlaps)**: 82.0% accuracy (n=478).
- **Category 1 (1 overlap)**: 83.8% accuracy (n=2719).
- **Category 2 (2 overlaps)**: 84.6% accuracy (n=441).
- **Category 3 (3 overlaps)**: 78.4% accuracy (n=37).
- **Overall Accuracy**: Red dashed line at 83.6%, spanning all categories.
### Key Observations
1. **Highest Accuracy**: Category 2 (2 overlaps) achieves the highest accuracy (84.6%) with a moderate sample size (n=441).
2. **Second-Highest**: Category 1 (1 overlap) follows closely at 83.8% with the largest sample size (n=2719).
3. **Lowest Accuracy**: Category 3 (3 overlaps) drops to 78.4%, with the smallest sample size (n=37).
4. **Overall Trend**: The overall accuracy (83.6%) aligns closely with the top two categories but is lower than the average of all four categories.
### Interpretation
The data suggests that higher overlap (up to 2) correlates with improved accuracy, but performance declines sharply at 3 overlaps. The overall accuracy of 83.6% is influenced by the large sample size in Category 1 and the smaller, lower-performing Category 3. The drop in accuracy at 3 overlaps may indicate diminishing returns or challenges with higher overlap thresholds. The small sample size in Category 3 (n=37) raises questions about the reliability of its 78.4% value, which could skew interpretations if extrapolated. The chart highlights a trade-off between overlap complexity and accuracy, with optimal performance at moderate overlap levels.