## Diagram: Key-Value Filtering and Similarity Selection
### Overview
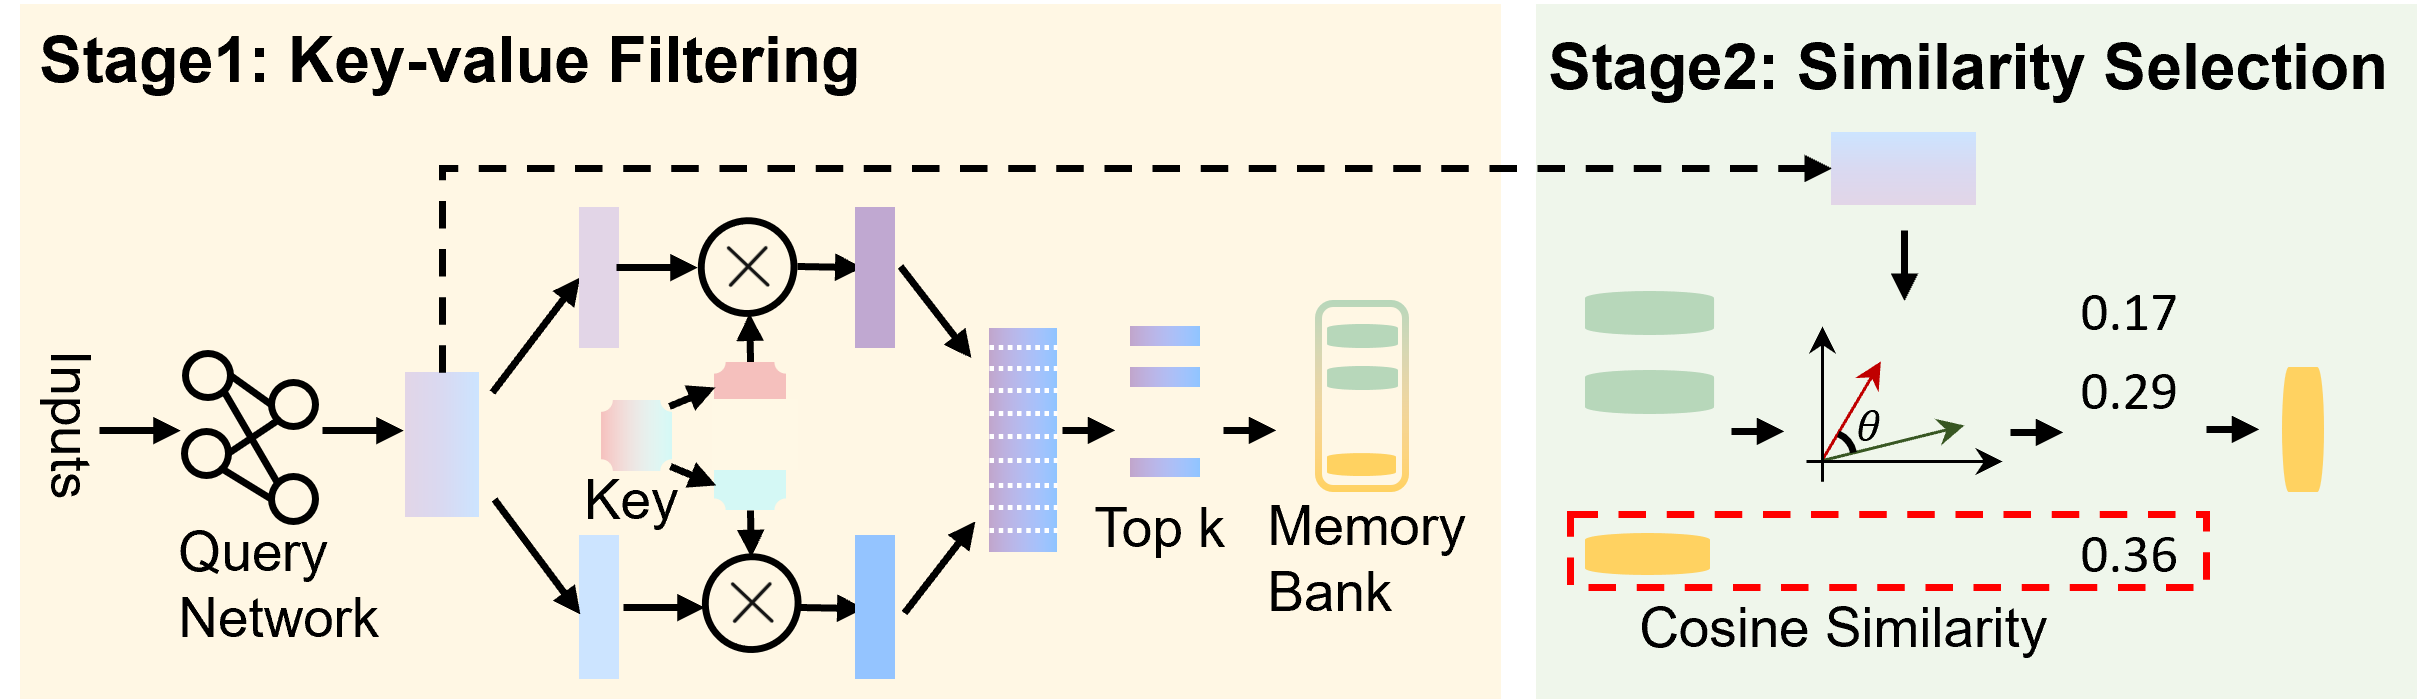
The image is a diagram illustrating a two-stage process: Key-value Filtering (Stage 1) and Similarity Selection (Stage 2). It depicts the flow of data through different components, including neural networks, memory banks, and similarity calculations.
### Components/Axes
**Stage 1: Key-value Filtering (Left Side)**
* **Inputs:** Located on the left, with an arrow pointing to the "Query Network".
* **Query Network:** A network represented by interconnected circles.
* **Key:** A labeled component in the middle of Stage 1.
* **Multiplication Circles:** Two circles with an "X" inside, representing multiplication operations.
* **Top k:** A component representing the selection of the top k values.
* **Memory Bank:** A vertical rectangle containing horizontal lines, representing a memory storage.
* **Arrows:** Arrows indicate the direction of data flow.
* **Dashed Line:** A dashed line connects the output of the "Query Network" to the input of "Stage 2".
**Stage 2: Similarity Selection (Right Side)**
* **Input:** Receives input from Stage 1 via a dashed line.
* **Green Cylinders:** Two green cylinders.
* **Angle θ:** An angle labeled "θ" between two vectors (one red, one green).
* **Cosine Similarity:** A red dashed box labeled "Cosine Similarity".
* **Output:** A yellow cylinder.
**Numerical Values:**
* 0.17
* 0.29
* 0.36
### Detailed Analysis
**Stage 1: Key-value Filtering**
1. **Input to Query Network:** The process begins with "Inputs" flowing into a "Query Network".
2. **Key Processing:** The "Query Network" output is split into two paths. One path goes directly to a multiplication circle. The other path interacts with a "Key" component before reaching another multiplication circle.
3. **Top k Selection:** The outputs of the multiplication circles are combined and fed into a "Top k" selection process.
4. **Memory Bank Access:** The selected "Top k" values are then used to access a "Memory Bank".
5. **Stage 1 Output:** The output of the "Memory Bank" is passed to Stage 2.
**Stage 2: Similarity Selection**
1. **Input from Stage 1:** Stage 2 receives input from Stage 1.
2. **Similarity Calculation:** The input is processed along with two green cylinders. The angle "θ" between two vectors (red and green) is used in a "Cosine Similarity" calculation.
3. **Numerical Values:** The values 0.17 and 0.29 are associated with the flow before the Cosine Similarity calculation. The value 0.36 is associated with the output of the Cosine Similarity calculation.
4. **Final Output:** The final output is represented by a yellow cylinder.
### Key Observations
* The diagram illustrates a two-stage process for filtering and selecting data based on key-value relationships and similarity measures.
* The "Key" component in Stage 1 plays a crucial role in filtering the data.
* Cosine similarity is used in Stage 2 to select the most similar data points.
* The numerical values (0.17, 0.29, 0.36) likely represent similarity scores or weights at different stages of the process.
### Interpretation
The diagram represents a system for retrieving information from a memory bank based on similarity to a query. In Stage 1, the "Query Network" generates a query vector, which is then filtered using a "Key". This filtering process selects the "Top k" most relevant entries from the memory bank. In Stage 2, the similarity between the retrieved entries and the original query is calculated using cosine similarity. The numerical values likely represent the similarity scores at different stages, with 0.36 being the final similarity score after the cosine similarity calculation. This process is useful for tasks such as information retrieval, recommendation systems, and machine translation, where it is necessary to find the most relevant information from a large database.