## Charts: Optimization Error vs. Alpha and Distribution of v
### Overview
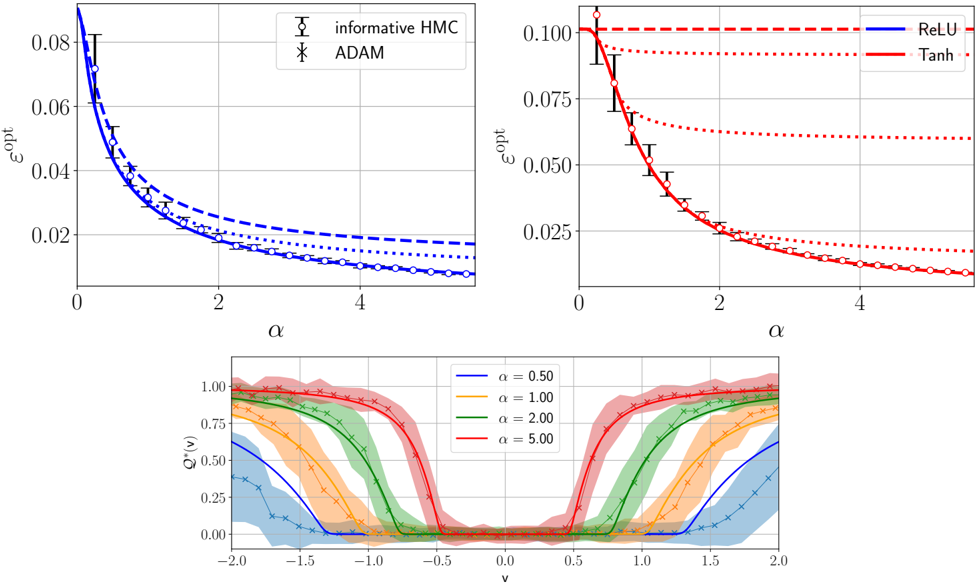
The image contains four charts presenting data related to optimization error (ε<sub>opt</sub>) and the distribution of a variable 'v' as a function of alpha (α). The top-left chart compares the optimization error for "informative HMC" and "ADAM" algorithms. The top-right chart shows the optimization error for "ReLU" and "Tanh" activation functions. The bottom chart displays the distribution of 'v' for different values of alpha.
### Components/Axes
* **Top-Left Chart:**
* X-axis: α (Alpha) - Scale from 0 to 5.
* Y-axis: ε<sub>opt</sub> (Optimization Error) - Scale from 0 to 0.08.
* Data Series:
* Informative HMC (Blue line with triangle markers)
* ADAM (Blue line with asterisk markers)
* **Top-Right Chart:**
* X-axis: α (Alpha) - Scale from 0 to 5.
* Y-axis: ε<sub>opt</sub> (Optimization Error) - Scale from 0 to 0.10.
* Data Series:
* ReLU (Red line)
* Tanh (Red dashed line)
* **Bottom Chart:**
* X-axis: v - Scale from -2.0 to 2.0.
* Y-axis: Q<sub>v</sub> - Scale from 0 to 1.0.
* Data Series:
* α = 0.50 (Blue line with cross markers)
* α = 1.00 (Orange line)
* α = 2.00 (Green line with cross markers)
* α = 5.00 (Red line with cross markers)
### Detailed Analysis or Content Details
* **Top-Left Chart:**
* The "informative HMC" line starts at approximately 0.07 and decreases to around 0.015 as α increases from 0 to 5.
* The "ADAM" line starts at approximately 0.05 and decreases to around 0.018 as α increases from 0 to 5.
* The "informative HMC" consistently shows a slightly lower optimization error than "ADAM" across all values of α.
* **Top-Right Chart:**
* The "ReLU" line starts at approximately 0.09 and decreases to around 0.025 as α increases from 0 to 5.
* The "Tanh" line starts at approximately 0.08 and decreases to around 0.03 as α increases from 0 to 5.
* "ReLU" consistently shows a lower optimization error than "Tanh" across all values of α. Error bars are present, indicating variance in the measurements.
* **Bottom Chart:**
* For α = 0.50, the distribution of 'v' is concentrated around 0, with a peak at approximately 0.25 and a value of around 0.1 at v = -1.5 and v = 1.5.
* For α = 1.00, the distribution of 'v' is broader and more uniform, with a peak around 0.5 and values around 0.3 at v = -1 and v = 1.
* For α = 2.00, the distribution of 'v' is even broader, with a peak around 0.75 and values around 0.5 at v = -0.5 and v = 0.5.
* For α = 5.00, the distribution of 'v' is the broadest, with a relatively flat distribution between -1 and 1, with values around 0.6.
### Key Observations
* Both "informative HMC" and "ADAM" show decreasing optimization error as α increases.
* "ReLU" consistently outperforms "Tanh" in terms of optimization error.
* The distribution of 'v' becomes broader and more uniform as α increases.
* The distributions of 'v' for different α values appear to be centered around 0.
### Interpretation
The data suggests that increasing α generally leads to lower optimization error for both algorithms and activation functions tested. The "informative HMC" algorithm and "ReLU" activation function consistently achieve lower optimization errors compared to "ADAM" and "Tanh", respectively. The broadening of the 'v' distribution with increasing α indicates a greater uncertainty or exploration of the parameter space. This could be due to the increased influence of noise or randomness as α increases. The relationship between α, optimization error, and the distribution of 'v' suggests a trade-off between exploitation (lower error) and exploration (broader distribution). The error bars in the top-right chart indicate that the observed differences in optimization error between ReLU and Tanh may not be statistically significant in some cases. The charts provide insights into the behavior of different optimization algorithms and activation functions in a specific context, potentially guiding the selection of appropriate techniques for machine learning tasks.