## Line Plots and Function Plot: Optimization Metrics vs. Alpha Parameter
### Overview
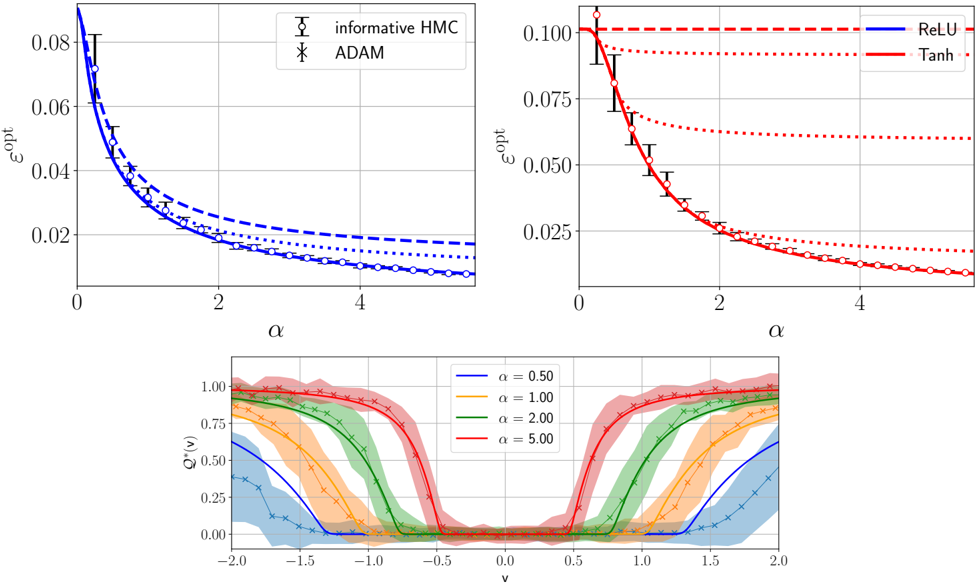
The image contains three plots analyzing optimization metrics across different alpha (α) values. The top-left plot compares two optimization methods (informative HMC and ADAM), the top-right plot compares activation functions (ReLU and Tanh), and the bottom plot shows a Q* function with varying α values. All plots exhibit decay trends with increasing α, suggesting parameter sensitivity in optimization dynamics.
### Components/Axes
1. **Top-Left Plot**:
- **X-axis**: α (0 to 4, linear scale)
- **Y-axis**: ε_opt (0.02 to 0.08, logarithmic-like decay)
- **Legend**:
- Solid blue circles: "informative HMC"
- Dashed blue crosses: "ADAM"
- **Trend**: Both methods show ε_opt decaying with α, with informative HMC consistently outperforming ADAM.
2. **Top-Right Plot**:
- **X-axis**: α (0 to 4, linear scale)
- **Y-axis**: ε_opt (0.025 to 0.10, logarithmic-like decay)
- **Legend**:
- Solid blue line: "ReLU"
- Solid red line: "Tanh"
- Dashed red line: Unlabeled (possibly baseline)
- **Trend**: ReLU starts highest (ε_opt ~0.10 at α=0), followed by Tanh (~0.075), then the dashed line (~0.05). All converge near ε_opt ~0.025 at α=4.
3. **Bottom Plot**:
- **X-axis**: v (-2 to 2, linear scale)
- **Y-axis**: Q*(v) (0 to 1, normalized)
- **Legend**:
- Blue: α=0.5
- Orange: α=1.0
- Green: α=2.0
- Red: α=5.0
- **Trend**: All curves form U-shaped valleys. Lower α (0.5) has wider, shallower valleys; higher α (5.0) has narrower, steeper valleys. Peaks at v=±2 decrease with α.
### Detailed Analysis
1. **Top-Left Plot**:
- At α=0: ε_opt ~0.08 (both methods).
- At α=4: ε_opt ~0.02 (informative HMC) vs. ~0.03 (ADAM).
- Error bars suggest ±0.005 uncertainty for informative HMC and ±0.01 for ADAM.
2. **Top-Right Plot**:
- At α=0: ReLU ε_opt=0.10, Tanh=0.075, dashed line=0.05.
- At α=4: All converge to ε_opt ~0.025.
- Dashed line likely represents a baseline (e.g., constant function).
3. **Bottom Plot**:
- α=0.5: Q*(-2)=0.25, Q*(2)=0.25, valley depth ~0.5.
- α=5.0: Q*(-2)=0.75, Q*(2)=0.75, valley depth ~0.25.
- Curves cross at v=0 for all α values.
### Key Observations
1. **Decay Trends**: All ε_opt metrics decrease with α, indicating improved optimization performance at higher α.
2. **Method Comparison**: Informative HMC outperforms ADAM across all α values.
3. **Activation Function Sensitivity**: ReLU exhibits the highest initial ε_opt but converges fastest.
4. **Q* Function Behavior**: Higher α values produce steeper Q* curves, suggesting increased sensitivity to input perturbations.
### Interpretation
The data demonstrates that:
- **Alpha Parameter Role**: Higher α values reduce optimization error (ε_opt) and sharpen Q* function valleys, implying stronger regularization or constraint enforcement.
- **Method Trade-offs**: Informative HMC’s superior performance suggests better handling of high-dimensional optimization landscapes compared to ADAM.
- **Activation Function Impact**: ReLU’s initial advantage over Tanh may reflect its non-saturating properties, though both converge under high α.
- **Q* Function Dynamics**: The U-shaped curves likely represent value function approximations in reinforcement learning, where higher α values prioritize exploitation over exploration.
The plots collectively highlight α as a critical hyperparameter balancing exploration (lower α) and exploitation (higher α) in optimization and decision-making frameworks.