## Line Chart: MathVista Accuracy vs. Number of Solutions per Problem
### Overview
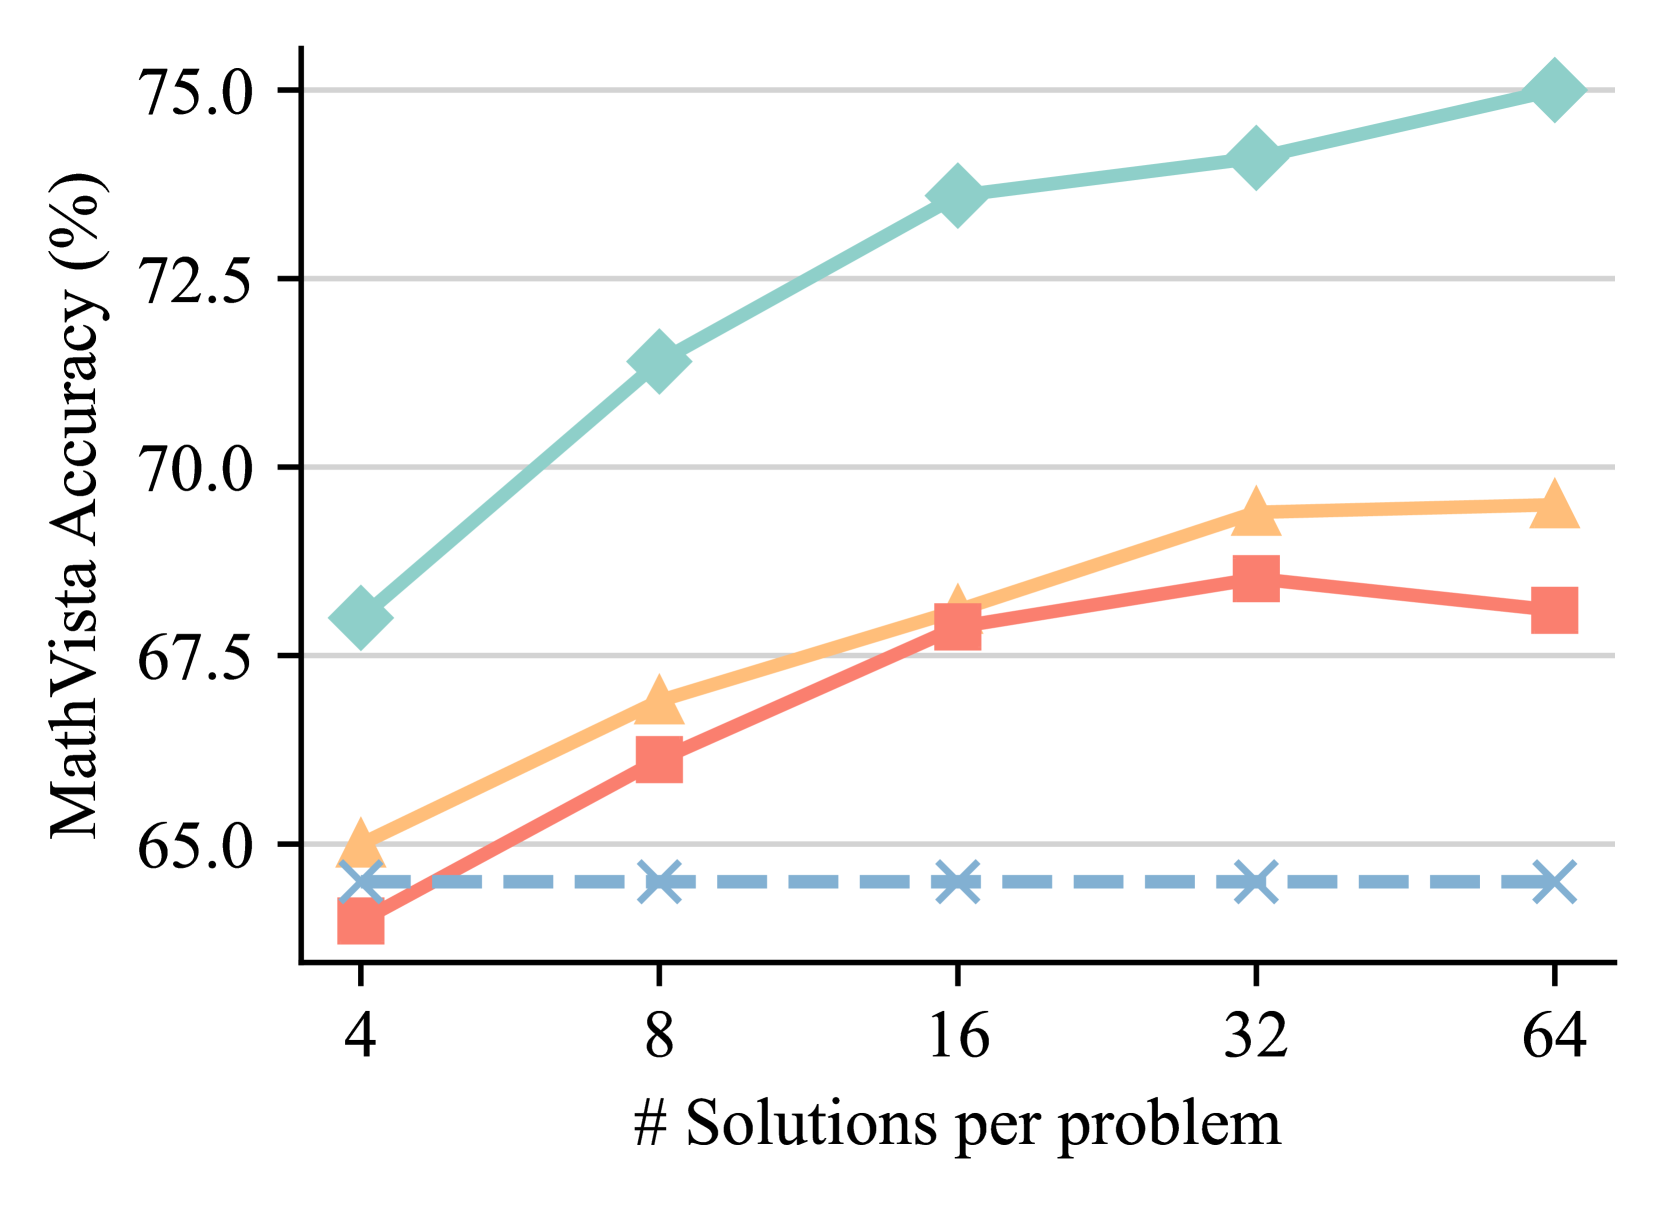
The image is a line chart comparing MathVista Accuracy (in percentage) against the number of solutions per problem. There are four data series represented by different colored lines: a teal line with diamond markers, a peach line with triangle markers, a coral line with square markers, and a light blue dashed line with 'x' markers. The chart shows how accuracy changes as the number of solutions increases.
### Components/Axes
* **Y-axis (Vertical):** "MathVista Accuracy (%)". The scale ranges from 65.0% to 75.0% with tick marks at 65.0, 67.5, 70.0, 72.5, and 75.0.
* **X-axis (Horizontal):** "# Solutions per problem". The scale has values 4, 8, 16, 32, and 64.
* **Data Series:** Four distinct lines, each with unique markers and colors.
### Detailed Analysis
* **Teal Line (Diamond Markers):** This line represents the highest accuracy among the four.
* At 4 solutions, the accuracy is approximately 68%.
* At 8 solutions, the accuracy is approximately 71.5%.
* At 16 solutions, the accuracy is approximately 73.5%.
* At 32 solutions, the accuracy is approximately 74%.
* At 64 solutions, the accuracy is approximately 75%.
* Trend: The teal line shows an upward trend, indicating increasing accuracy with more solutions, but the rate of increase slows down as the number of solutions increases.
* **Peach Line (Triangle Markers):** This line shows a moderate level of accuracy.
* At 4 solutions, the accuracy is approximately 65%.
* At 8 solutions, the accuracy is approximately 67%.
* At 16 solutions, the accuracy is approximately 68%.
* At 32 solutions, the accuracy is approximately 69.5%.
* At 64 solutions, the accuracy is approximately 69.5%.
* Trend: The peach line shows an upward trend initially, but plateaus after 32 solutions.
* **Coral Line (Square Markers):** This line shows a lower level of accuracy compared to the teal and peach lines.
* At 4 solutions, the accuracy is approximately 64%.
* At 8 solutions, the accuracy is approximately 66%.
* At 16 solutions, the accuracy is approximately 68%.
* At 32 solutions, the accuracy is approximately 68.5%.
* At 64 solutions, the accuracy is approximately 68%.
* Trend: The coral line shows an upward trend initially, but plateaus and slightly decreases after 32 solutions.
* **Light Blue Dashed Line (X Markers):** This line represents the lowest and most stable accuracy.
* The accuracy remains constant at approximately 65% across all solution counts.
* Trend: The light blue line is relatively flat, indicating no significant change in accuracy with an increasing number of solutions.
### Key Observations
* The teal line (diamond markers) consistently outperforms the other lines in terms of accuracy.
* The light blue dashed line (X markers) shows no improvement in accuracy as the number of solutions increases.
* The peach and coral lines show improvement up to 32 solutions, after which they plateau or slightly decline.
### Interpretation
The chart suggests that increasing the number of solutions per problem generally improves MathVista accuracy, but the extent of improvement varies depending on the specific approach represented by each line. The teal line represents the most effective approach, as it consistently achieves the highest accuracy with increasing solutions. The light blue line likely represents a baseline or control method that does not benefit from additional solutions. The peach and coral lines show diminishing returns after a certain point, suggesting that their effectiveness plateaus beyond 32 solutions per problem.