## Line Chart: MathVista Accuracy vs. Solutions per Problem
### Overview
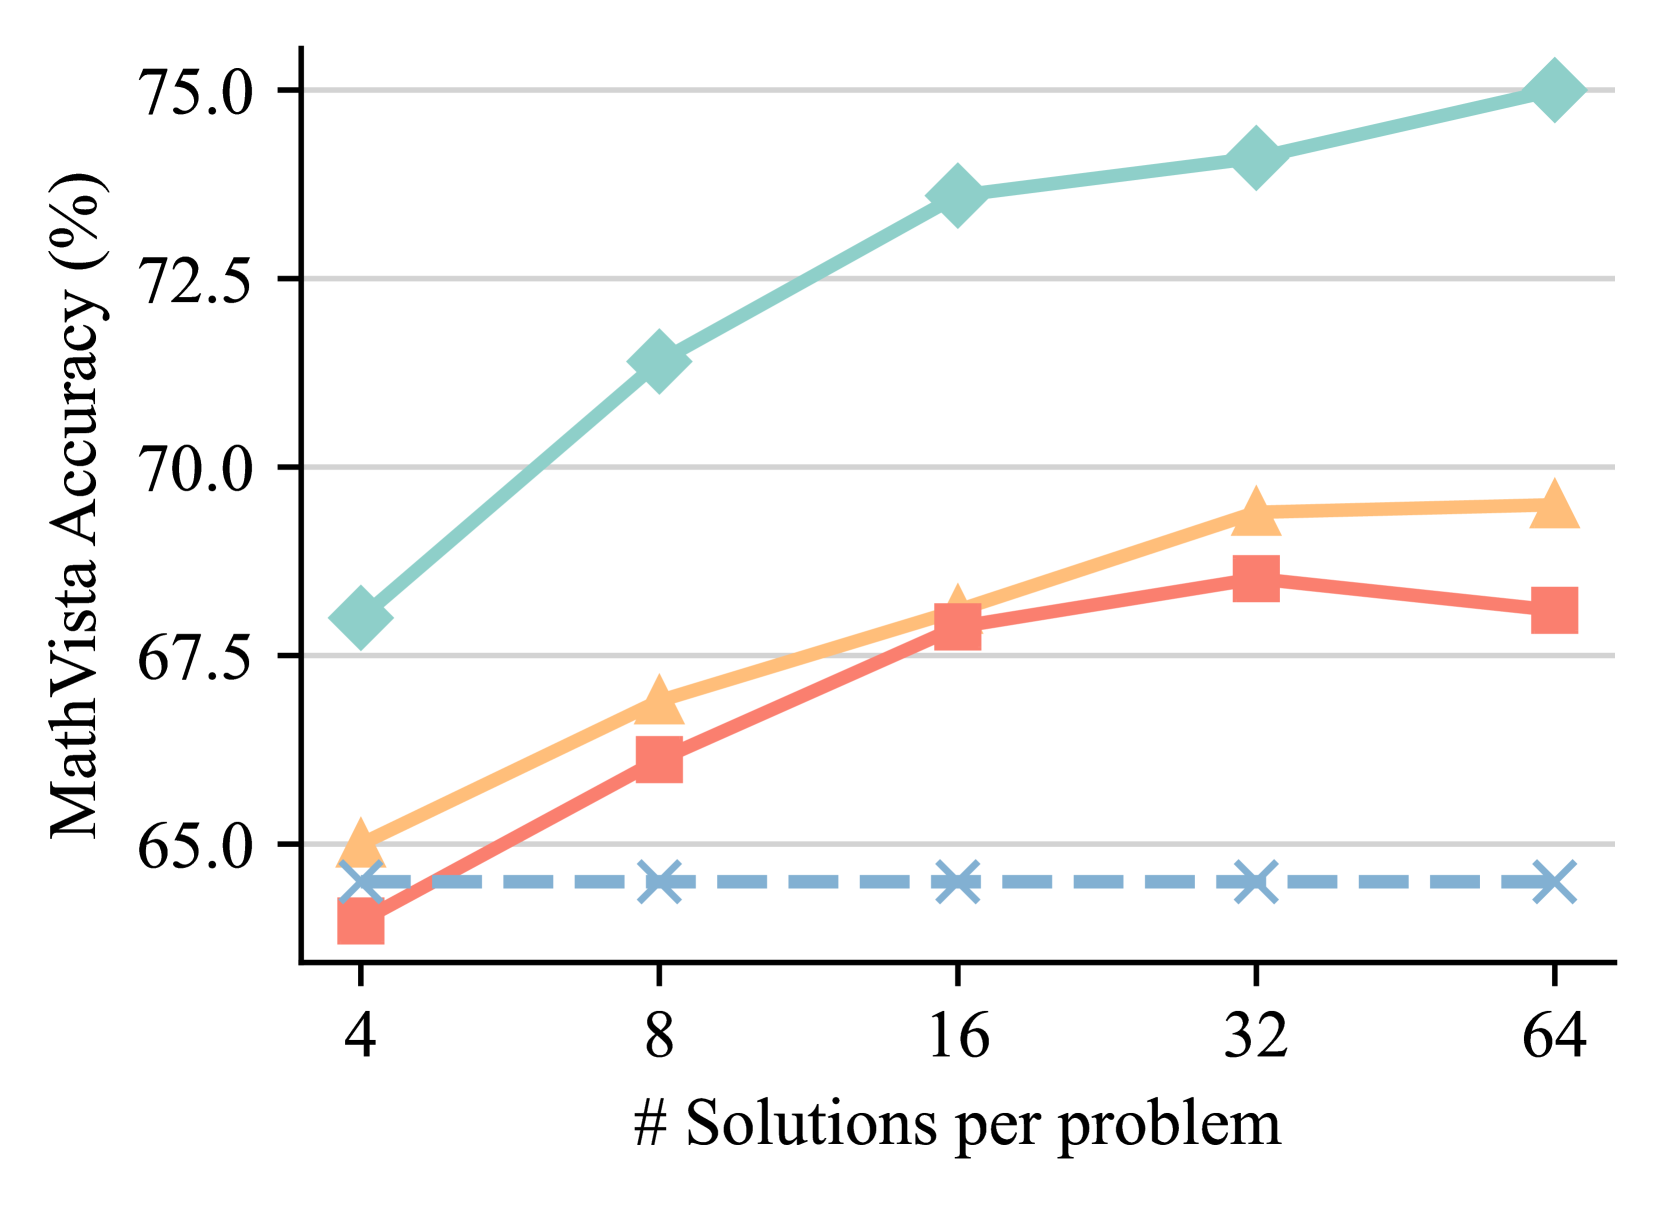
This line chart depicts the relationship between the number of solutions per problem and the MathVista accuracy (expressed as a percentage). Four different data series are plotted, each represented by a distinct line and marker. The x-axis represents the number of solutions per problem, and the y-axis represents the MathVista accuracy.
### Components/Axes
* **Title:** Not explicitly present, but the chart's content suggests a title relating to MathVista accuracy and solutions per problem.
* **X-axis Label:** "# Solutions per problem"
* **X-axis Markers:** 4, 8, 16, 32, 64
* **Y-axis Label:** "MathVista Accuracy (%)"
* **Y-axis Scale:** Ranges from approximately 65.0% to 75.0%.
* **Legend:** No explicit legend is present, but the lines are distinguishable by color and style.
* **Line A (Green):** Solid line with triangular markers.
* **Line B (Orange):** Solid line with square markers.
* **Line C (Red):** Solid line with diamond markers.
* **Line D (Blue):** Dashed line with cross markers.
### Detailed Analysis
* **Line A (Green):** This line shows a consistently upward trend, starting at approximately 67.5% accuracy at 4 solutions per problem and increasing to approximately 74.5% accuracy at 64 solutions per problem.
* At 4 solutions: ~67.5%
* At 8 solutions: ~70.5%
* At 16 solutions: ~72.5%
* At 32 solutions: ~73.5%
* At 64 solutions: ~74.5%
* **Line B (Orange):** This line initially increases, then plateaus. It starts at approximately 65.5% accuracy at 4 solutions, rises to approximately 69.5% at 32 solutions, and then remains relatively stable at around 69.0% at 64 solutions.
* At 4 solutions: ~65.5%
* At 8 solutions: ~66.5%
* At 16 solutions: ~68.0%
* At 32 solutions: ~69.5%
* At 64 solutions: ~69.0%
* **Line C (Red):** This line shows a moderate upward trend, starting at approximately 66.0% accuracy at 4 solutions and increasing to approximately 68.5% accuracy at 64 solutions.
* At 4 solutions: ~66.0%
* At 8 solutions: ~66.5%
* At 16 solutions: ~67.0%
* At 32 solutions: ~68.0%
* At 64 solutions: ~68.5%
* **Line D (Blue):** This line remains relatively flat across all values of solutions per problem, hovering around 65.0% accuracy.
* At 4 solutions: ~65.0%
* At 8 solutions: ~65.0%
* At 16 solutions: ~65.0%
* At 32 solutions: ~65.0%
* At 64 solutions: ~65.0%
### Key Observations
* Line A (Green) consistently outperforms the other lines, demonstrating the highest accuracy across all solution counts.
* Line D (Blue) shows minimal improvement with an increasing number of solutions, indicating a limited benefit from additional solutions for this particular data series.
* Line B (Orange) shows initial gains, but its accuracy plateaus after 32 solutions.
* The accuracy of Line C (Red) increases steadily, but at a slower rate than Line A (Green).
### Interpretation
The chart suggests that increasing the number of solutions per problem generally improves MathVista accuracy, but the extent of this improvement varies depending on the data series. Line A demonstrates a strong positive correlation, indicating that providing more solutions significantly enhances accuracy. Line D, however, shows that for some cases, increasing the number of solutions has little to no impact on accuracy. This could be due to the nature of the problems, the algorithm used, or other underlying factors. The plateau observed in Line B suggests a point of diminishing returns, where additional solutions no longer contribute to significant accuracy gains. The differences between the lines could represent different algorithms, different problem types, or different levels of problem difficulty. The data suggests that optimizing the number of solutions per problem is crucial for maximizing MathVista accuracy, and the optimal number may vary depending on the specific context.