## Scatter Plot: CausalCite Comparison of ToT vs. Non-ToT
### Overview
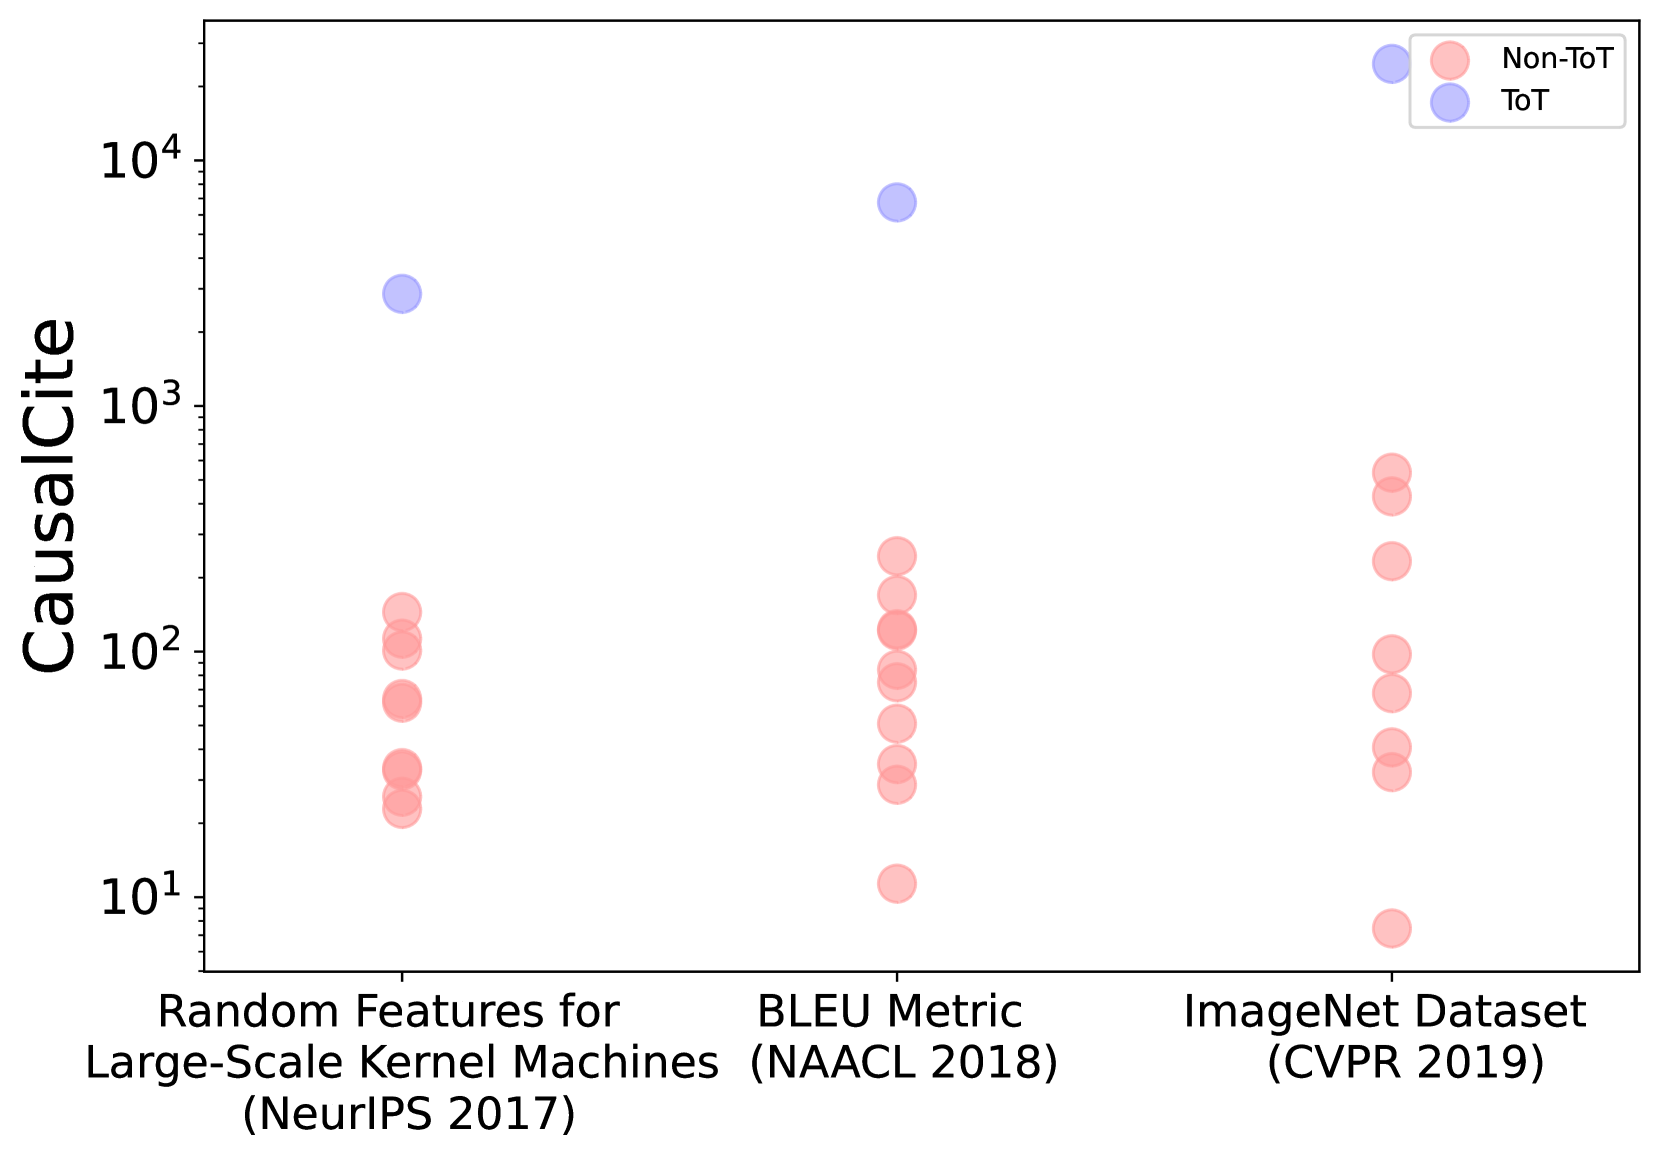
The image is a scatter plot comparing the "CausalCite" values for two categories: "ToT" (Tree of Thoughts) and "Non-ToT". The x-axis represents different benchmarks or datasets, while the y-axis represents the "CausalCite" value on a logarithmic scale. Each data point is represented by a circle, with blue circles indicating "ToT" and red circles indicating "Non-ToT".
### Components/Axes
* **Y-axis:** "CausalCite" (logarithmic scale). Axis markers are at 10<sup>1</sup>, 10<sup>2</sup>, 10<sup>3</sup>, and 10<sup>4</sup>.
* **X-axis:** Categorical axis with three categories:
* "Random Features for Large-Scale Kernel Machines (NeurIPS 2017)"
* "BLEU Metric (NAACL 2018)"
* "ImageNet Dataset (CVPR 2019)"
* **Legend:** Located in the top-right corner.
* Red circle: "Non-ToT"
* Blue circle: "ToT"
### Detailed Analysis
* **Random Features for Large-Scale Kernel Machines (NeurIPS 2017):**
* "Non-ToT" (red): Several data points are clustered between approximately 20 and 200.
* "ToT" (blue): One data point at approximately 3000.
* **BLEU Metric (NAACL 2018):**
* "Non-ToT" (red): Several data points are clustered between approximately 20 and 200.
* "ToT" (blue): One data point at approximately 8000.
* **ImageNet Dataset (CVPR 2019):**
* "Non-ToT" (red): Several data points are scattered between approximately 10 and 500.
* "ToT" (blue): No data points are present for ToT.
### Key Observations
* For both "Random Features" and "BLEU Metric", the "ToT" data point has a significantly higher "CausalCite" value compared to the "Non-ToT" data points.
* For "ImageNet Dataset", only "Non-ToT" data points are present.
* The "Non-ToT" data points are clustered within a relatively narrow range for each category, while the "ToT" data points are outliers with much higher values.
### Interpretation
The scatter plot suggests that "ToT" (Tree of Thoughts) significantly improves the "CausalCite" value compared to "Non-ToT" for the "Random Features" and "BLEU Metric" benchmarks. The absence of "ToT" data for the "ImageNet Dataset" prevents a direct comparison for that category. The clustering of "Non-ToT" data points indicates a consistent baseline performance, while the "ToT" outliers suggest a substantial performance boost in specific cases. The plot highlights the potential benefits of using "ToT" in certain applications, as measured by the "CausalCite" metric.