\n
## Scatter Plot: CausalCite vs. Dataset/Metric
### Overview
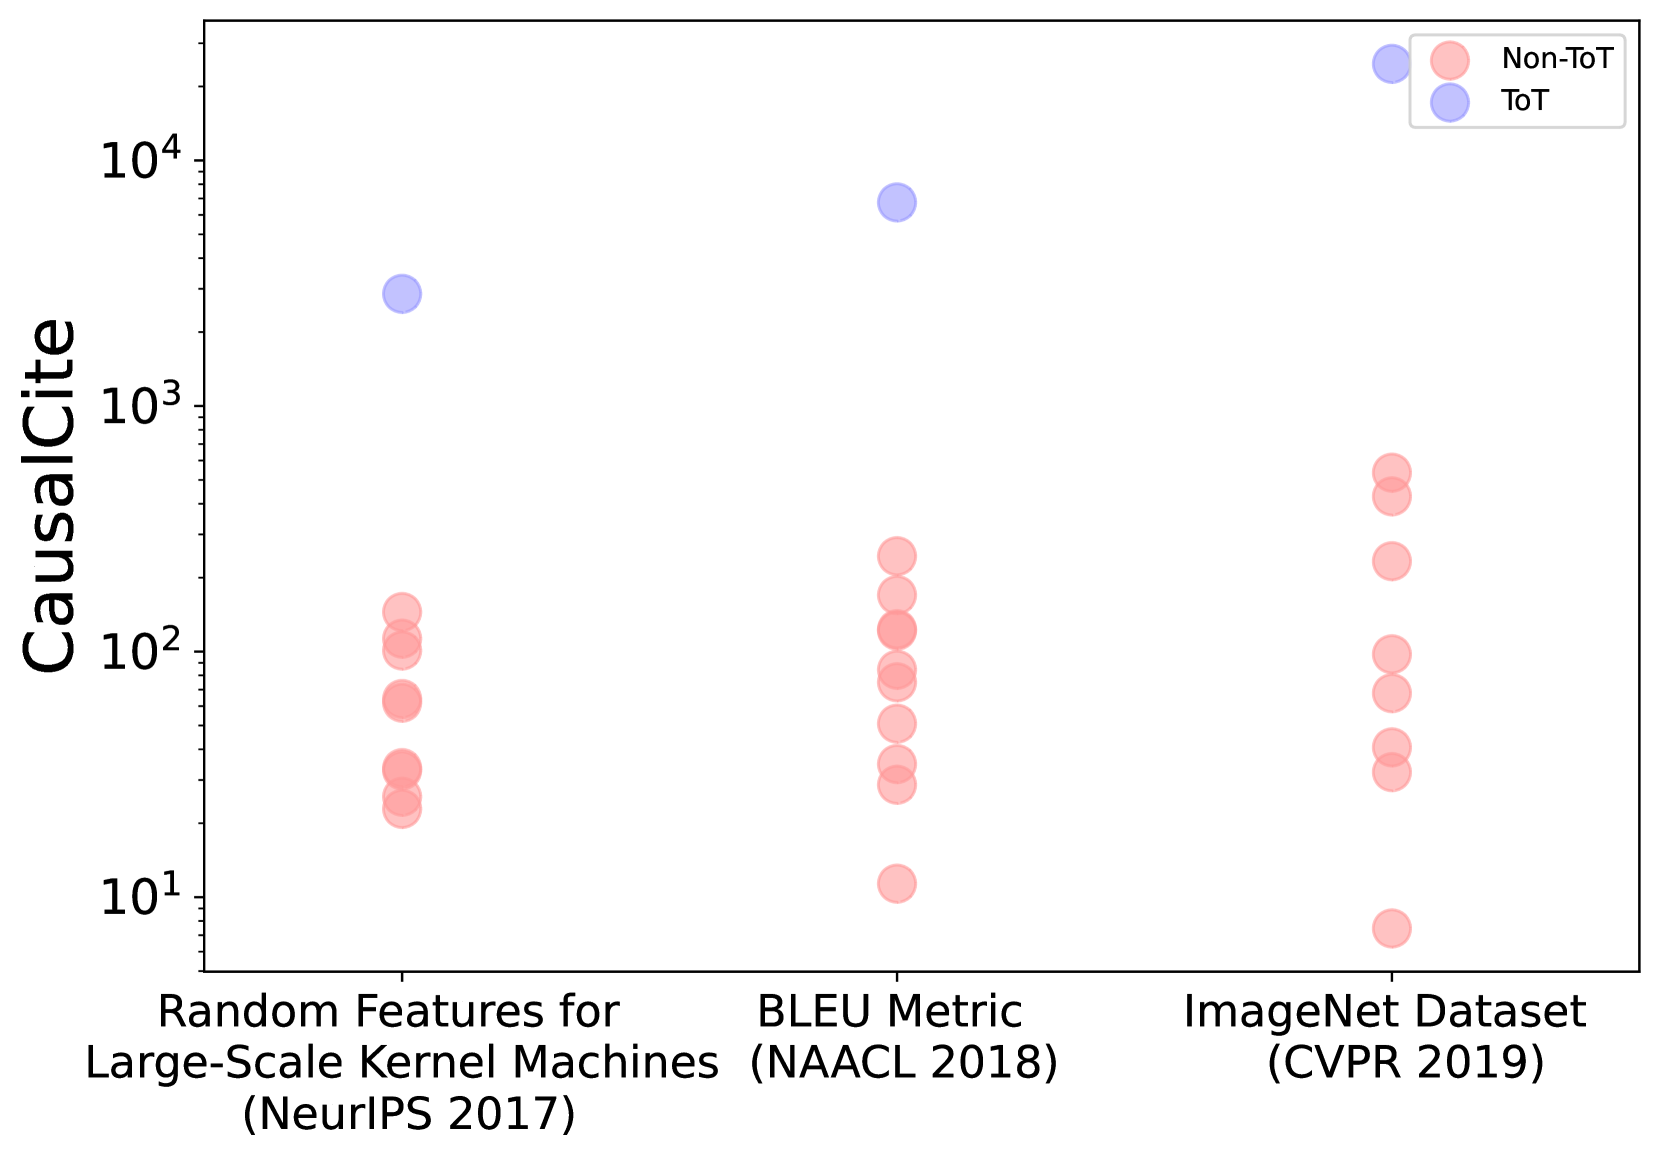
This image presents a scatter plot comparing the CausalCite metric across three different datasets/metrics: "Random Features for Large-Scale Kernel Machines (NeurIPS 2017)", "BLEU Metric (NAACL 2018)", and "ImageNet Dataset (CVPR 2019)". The data points are color-coded to distinguish between "Non-ToT" and "ToT" (presumably representing two different methodologies or conditions). The y-axis is on a logarithmic scale.
### Components/Axes
* **Y-axis:** CausalCite (logarithmic scale, ranging approximately from 1 to 10,000). Markers are at 1, 10, 100, 1000, 10000.
* **X-axis:** Datasets/Metrics: "Random Features for Large-Scale Kernel Machines (NeurIPS 2017)", "BLEU Metric (NAACL 2018)", "ImageNet Dataset (CVPR 2019)".
* **Legend:** Located in the top-right corner.
* Purple circles: "Non-ToT"
* Red circles: "ToT"
### Detailed Analysis
The plot shows the distribution of CausalCite values for each dataset/metric, separated by "Non-ToT" and "ToT".
**Random Features for Large-Scale Kernel Machines (NeurIPS 2017):**
* **Non-ToT (Purple):** One data point at approximately 1,600.
* **ToT (Red):** Five data points, ranging from approximately 10 to 100.
**BLEU Metric (NAACL 2018):**
* **Non-ToT (Purple):** Four data points, ranging from approximately 100 to 300.
* **ToT (Red):** Four data points, ranging from approximately 1 to 10.
**ImageNet Dataset (CVPR 2019):**
* **Non-ToT (Purple):** Three data points, ranging from approximately 300 to 600.
* **ToT (Red):** Four data points, ranging from approximately 10 to 100.
### Key Observations
* The "Non-ToT" data points generally have higher CausalCite values than the "ToT" data points across all three datasets/metrics.
* The spread of data points is wider for "Non-ToT" in most cases, indicating greater variability.
* The "Random Features" dataset shows the highest CausalCite value for "Non-ToT".
* The "BLEU Metric" dataset shows the highest CausalCite values for "Non-ToT" and the lowest for "ToT".
### Interpretation
The data suggests that the "Non-ToT" methodology consistently yields higher CausalCite scores compared to the "ToT" methodology across the evaluated datasets. This could indicate that "Non-ToT" is more effective at identifying causal relationships within these datasets, or that the CausalCite metric is more sensitive to the characteristics of the "Non-ToT" approach. The variability in CausalCite scores within the "Non-ToT" group suggests that the effectiveness of this methodology may be more dependent on the specific dataset being analyzed. The relatively low CausalCite scores for "ToT" across all datasets might indicate a limitation of this approach in capturing causal relationships, or that the metric is not well-suited for evaluating it. The differences in the range of CausalCite values across the three datasets suggest that the underlying causal structures within these datasets vary significantly. Further investigation is needed to understand the specific factors driving these differences and to determine the optimal methodology for causal inference in each context.