\n
## Scatter Plot: CausalCite Values for Non-ToT vs. ToT Methods Across Three Research Papers
### Overview
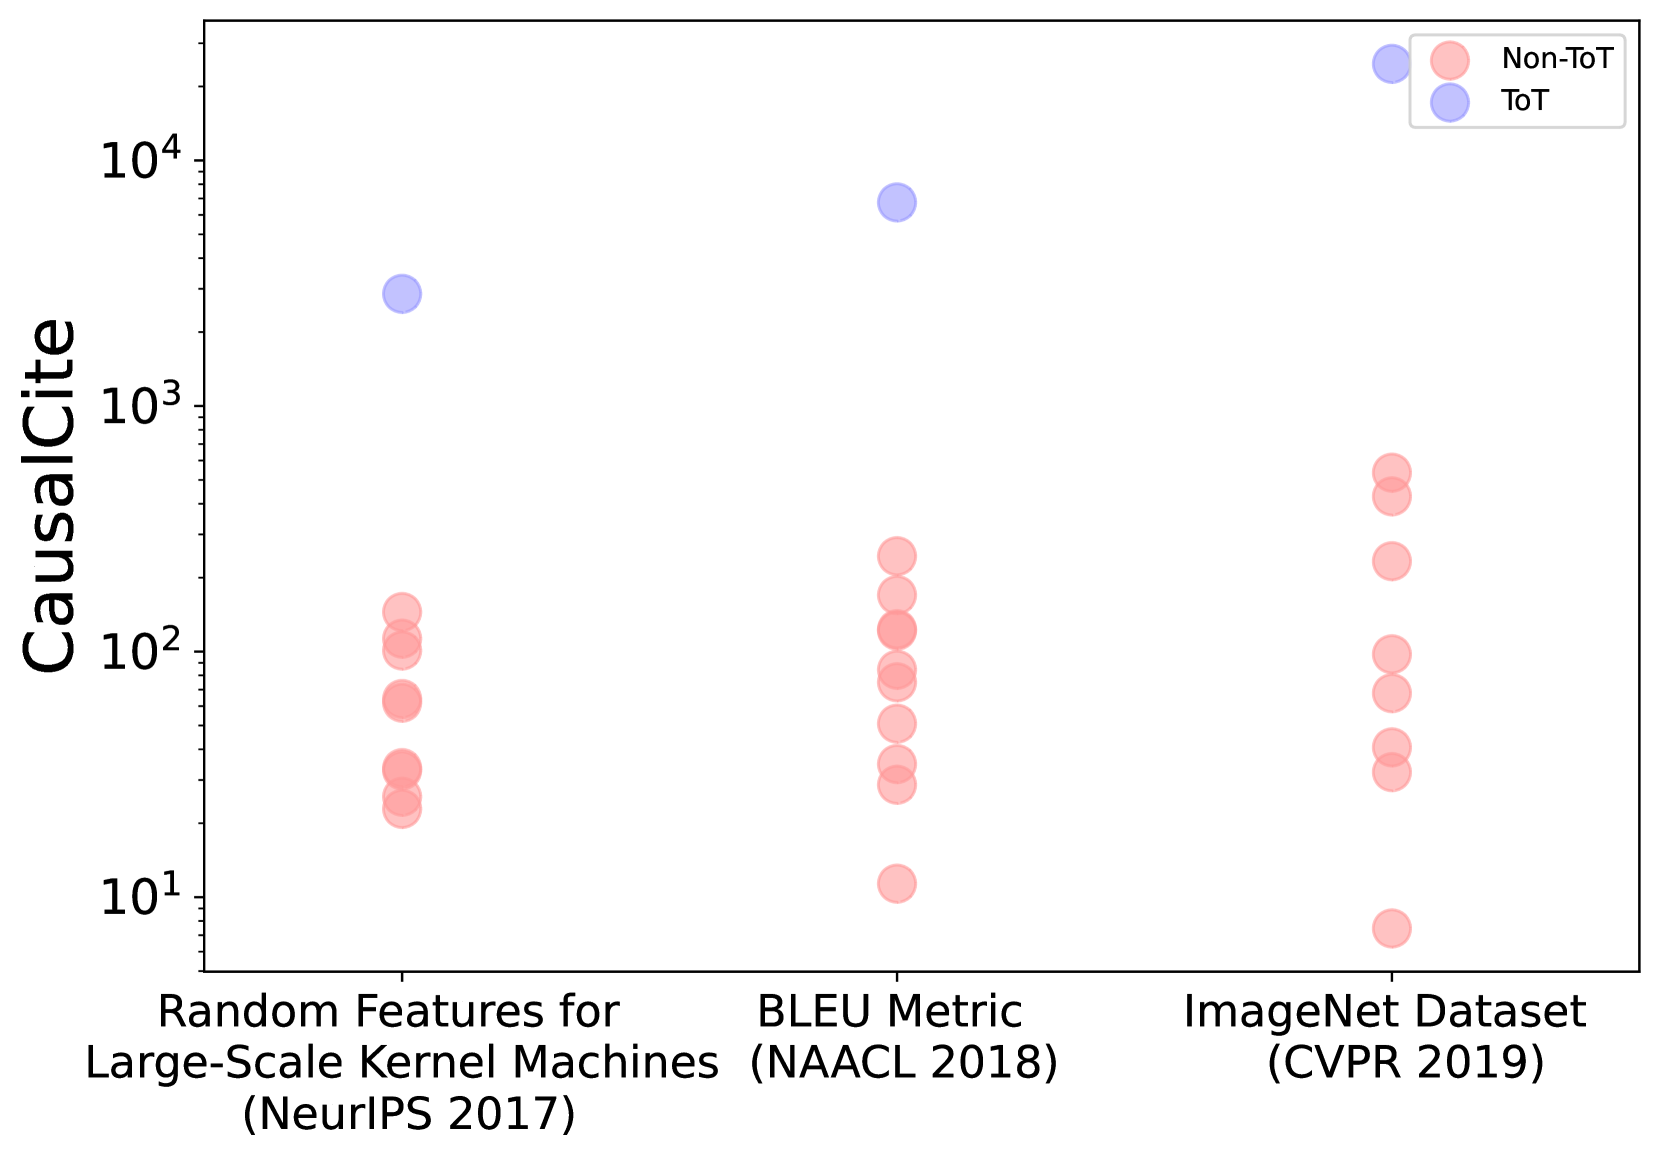
This image is a scatter plot comparing the "CausalCite" metric for two categories of methods—labeled "Non-ToT" and "ToT"—across three distinct research papers. The y-axis uses a logarithmic scale. The plot visually demonstrates a significant disparity in CausalCite values between the two method categories for each paper.
### Components/Axes
- **Y-Axis:**
- **Label:** `CausalCite`
- **Scale:** Logarithmic (base 10). Major tick marks are at `10^1`, `10^2`, `10^3`, and `10^4`.
- **X-Axis:**
- **Categories (from left to right):**
1. `Random Features for Large-Scale Kernel Machines (NeurIPS 2017)`
2. `BLEU Metric (NAACL 2018)`
3. `ImageNet Dataset (CVPR 2019)`
- **Legend:**
- **Position:** Top-right corner of the plot area.
- **Categories:**
- `Non-ToT`: Represented by pink/salmon-colored circles.
- `ToT`: Represented by light blue/periwinkle-colored circles.
### Detailed Analysis
Data points are plotted as circles. For each x-axis category, multiple "Non-ToT" points are shown, while only one "ToT" point is visible.
**1. Random Features for Large-Scale Kernel Machines (NeurIPS 2017)**
- **Non-ToT (Pink):** A cluster of approximately 6-7 points. Their approximate CausalCite values range from just above `10^1` (~20) to just above `10^2` (~150). The points are densely packed between `10^1.5` (~30) and `10^2`.
- **ToT (Blue):** A single point located significantly higher, at approximately `10^3.4` (~2500).
**2. BLEU Metric (NAACL 2018)**
- **Non-ToT (Pink):** A cluster of approximately 8-9 points. Values range from `10^1` (10) to approximately `10^2.4` (~250). One outlier point is near the bottom at `10^1` (10).
- **ToT (Blue):** A single point located very high, at approximately `10^3.8` (~6300).
**3. ImageNet Dataset (CVPR 2019)**
- **Non-ToT (Pink):** A cluster of approximately 7-8 points. Values range from below `10^1` (~7) to approximately `10^2.8` (~630). The spread is wider here, with points near the bottom and top of this range.
- **ToT (Blue):** A single point located at the highest position on the entire chart, at approximately `10^4.3` (~20,000).
### Key Observations
1. **Consistent Disparity:** For all three papers, the single "ToT" data point has a CausalCite value one to two orders of magnitude (10x to 100x) higher than the cluster of "Non-ToT" points.
2. **Logarithmic Scale Necessity:** The use of a log scale is essential to visualize both the low-value "Non-ToT" cluster and the high-value "ToT" point on the same chart.
3. **Clustering vs. Singularity:** "Non-ToT" methods are represented by multiple data points per paper, suggesting a distribution of results or multiple studies. "ToT" is represented by a single, dominant point per paper.
4. **Trend Across Papers:** The CausalCite value for the "ToT" point appears to increase from the first paper (NeurIPS 2017) to the third (CVPR 2019).
### Interpretation
The chart presents a strong visual argument that methods or concepts associated with "ToT" (the exact meaning of the acronym is not defined in the image) have a dramatically higher "CausalCite" metric compared to "Non-ToT" approaches within the context of these three influential machine learning papers.
- **What it suggests:** "CausalCite" likely measures some form of impact, influence, or causal attribution within the academic literature. The data implies that the "ToT" element in each paper is considered far more causally significant or foundational by the metric's definition.
- **Relationship between elements:** The plot isolates and contrasts two classes of contribution within each paper. The stark separation suggests "ToT" is not just marginally better but represents a different tier of impact as measured by CausalCite.
- **Notable pattern:** The increasing CausalCite value for the "ToT" point across the three papers (from ~2500 to ~20,000) could indicate that the concept or method labeled "ToT" gained increasing recognition or became more foundational in subsequent, high-profile research (from NeurIPS to CVPR).
- **Underlying question:** The chart raises a critical question about the nature of "ToT." Is it a specific technique, a theoretical framework, or a key finding? Its consistent, outsized impact across different sub-fields (kernel methods, NLP metrics, computer vision datasets) suggests it may be a broadly applicable and highly influential concept. The chart effectively argues for the paramount importance of the "ToT" component in these works.