## Scatter Plot: CausalCite Values Across Research Categories
### Overview
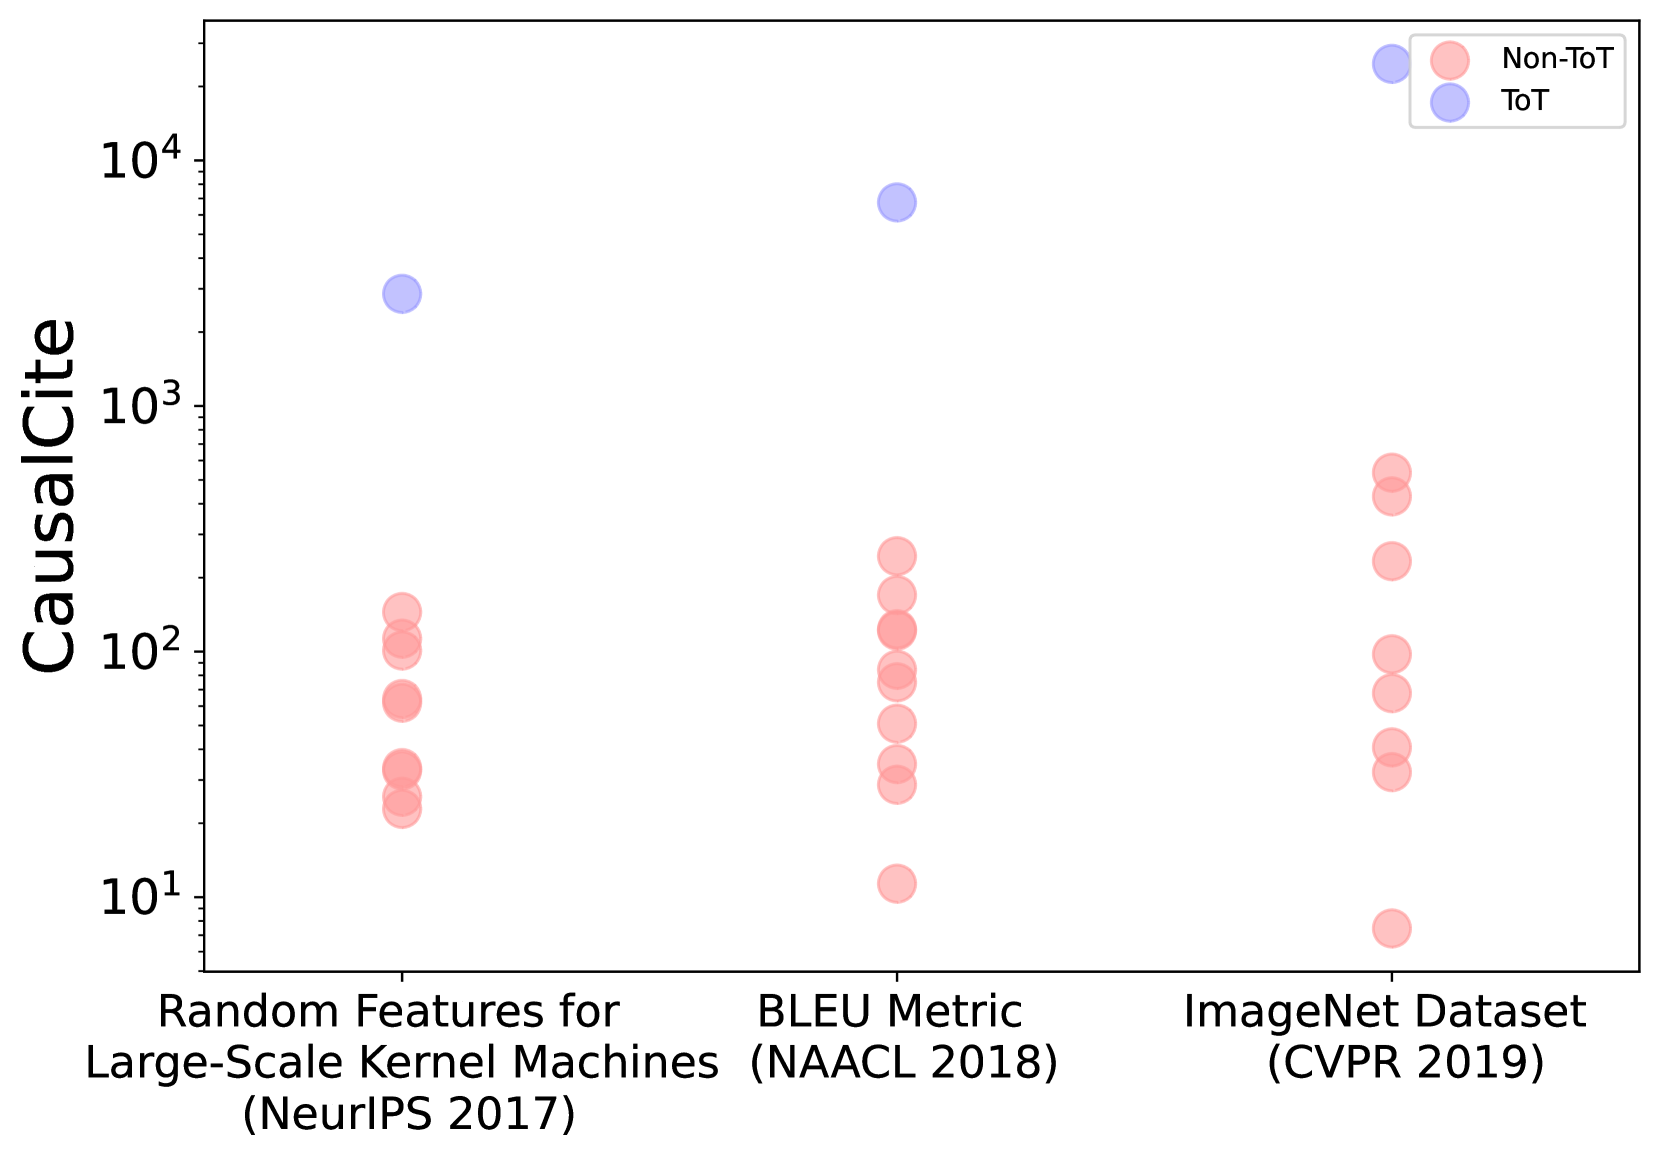
The image is a scatter plot comparing "CausalCite" values (logarithmic scale) across three research categories:
1. **Random Features for Large-Scale Kernel Machines** (NeurIPS 2017)
2. **BLEU Metric** (NAACL 2018)
3. **ImageNet Dataset** (CVPR 2019)
Data points are color-coded: **Non-ToT** (pink) and **ToT** (blue), with the legend positioned in the top-right corner.
---
### Components/Axes
- **X-Axis**:
- Categories:
1. Random Features for Large-Scale Kernel Machines (NeurIPS 2017)
2. BLEU Metric (NAACL 2018)
3. ImageNet Dataset (CVPR 2019)
- Positioning: Centered labels with parentheses indicating conferences/years.
- **Y-Axis**:
- Label: "CausalCite"
- Scale: Logarithmic (10¹ to 10⁴).
- **Legend**:
- Top-right corner.
- Pink = Non-ToT, Blue = ToT.
---
### Detailed Analysis
#### Non-ToT (Pink) Data Points:
- **Random Features (NeurIPS 2017)**:
- Values: ~10¹.⁵ to ~10².
- Distribution: Clustered tightly between 10¹ and 10².
- **BLEU Metric (NAACL 2018)**:
- Values: ~10¹ to ~10².⁵.
- Distribution: Spread across the lower range, with one outlier at ~10¹.
- **ImageNet Dataset (CVPR 2019)**:
- Values: ~10¹ to ~10³.
- Distribution: Broader spread, peaking near 10³.
#### ToT (Blue) Data Points:
- **Random Features (NeurIPS 2017)**:
- Values: ~10³.⁵.
- Position: Single point near the top of the y-axis.
- **BLEU Metric (NAACL 2018)**:
- Values: ~10³.⁵ to ~10⁴.
- Position: Clustered near the top of the y-axis.
- **ImageNet Dataset (CVPR 2019)**:
- Values: ~10³ to ~10⁴.
- Position: Highest values in the dataset, with one point at ~10⁴.
---
### Key Observations
1. **ToT Dominates CausalCite**:
- ToT values consistently exceed Non-ToT across all categories.
- Largest gap in **ImageNet Dataset** (ToT: ~10⁴ vs. Non-ToT: ~10³).
2. **Category-Specific Trends**:
- **BLEU Metric** (NAACL 2018): Highest ToT value (~10⁴).
- **Random Features** (NeurIPS 2017): Lowest ToT value (~10³.⁵).
3. **Outliers**:
- Non-ToT in BLEU Metric has one outlier at ~10¹.
- ToT in Random Features has a single high-value point (~10³.⁵).
---
### Interpretation
The data suggests that **ToT methods significantly increase citation impact** compared to Non-ToT approaches. This trend is most pronounced in the **ImageNet Dataset** (CVPR 2019), where ToT achieves ~10× higher CausalCite than Non-ToT. The BLEU Metric (NAACL 2018) shows the highest ToT value, potentially due to its application in NLP tasks with high practical relevance. Conversely, the Random Features category (NeurIPS 2017) exhibits lower citation impact, possibly reflecting its theoretical nature. The logarithmic y-axis emphasizes exponential differences, highlighting ToT's scalability in generating impactful research.