\n
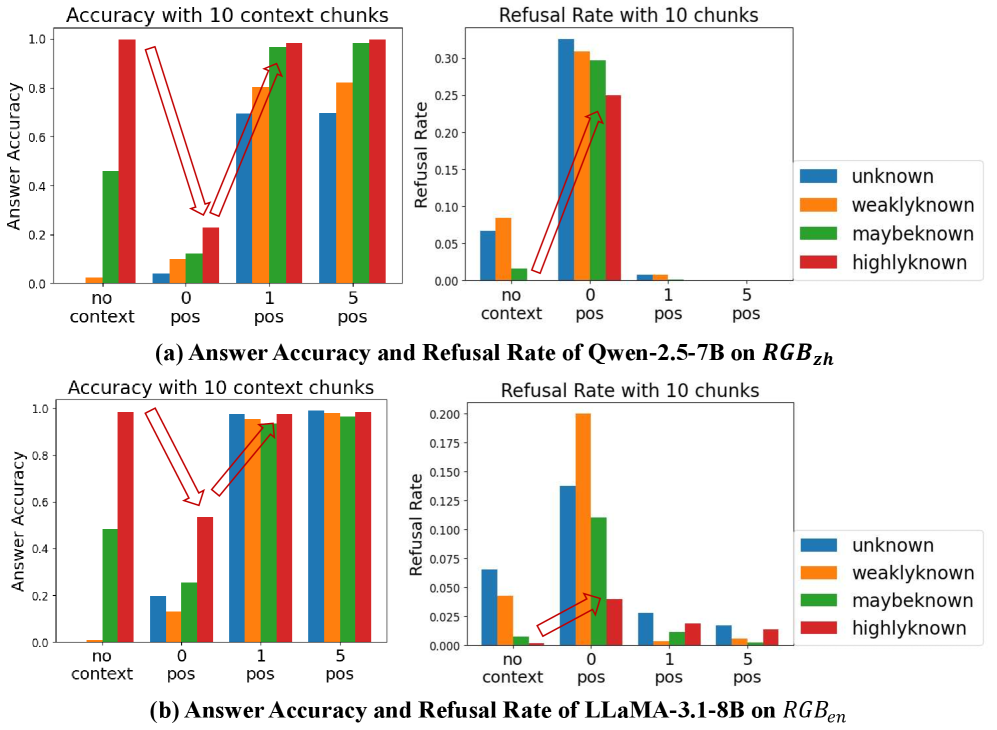
## Bar Charts: Answer Accuracy and Refusal Rate with Context Chunks
### Overview
The image presents four bar charts, arranged in a 2x2 grid. The charts compare the answer accuracy and refusal rate of two language models, Qwen-2.5-7B and LLaMA-3.1-8B, across varying numbers of context chunks (no context, 0 pos, 1 pos, 5 pos). Each chart displays accuracy/refusal rate for four knowledge states: unknown, weakly known, maybe known, and highly known. Arrows indicate trends between context chunk levels.
### Components/Axes
* **X-axis (all charts):** Context Chunks - labeled as "no context", "0 pos", "1 pos", "5 pos".
* **Y-axis (left charts):** Answer Accuracy - scale from 0.0 to 1.0.
* **Y-axis (right charts):** Refusal Rate - scale from 0.0 to 0.3.
* **Legend (bottom-right of each pair of charts):**
* unknown (blue)
* weaklyknown (orange)
* maybeknown (green)
* highlyknown (red)
* **Titles:**
* (a) Answer Accuracy and Refusal Rate of Qwen-2.5-7B on RGB<sub>zh</sub>
* (b) Answer Accuracy and Refusal Rate of LLaMA-3.1-8B on RGB<sub>en</sub>
### Detailed Analysis or Content Details
**Chart (a) - Qwen-2.5-7B on RGB<sub>zh</sub>**
* **Accuracy Chart (top-left):**
* **Unknown:** Starts at approximately 0.25, increases to 0.35, then to 0.4, and finally to 0.45.
* **Weaklyknown:** Starts at approximately 0.3, increases sharply to 0.7, then to 0.75, and finally to 0.8.
* **Maybeknown:** Starts at approximately 0.4, increases to 0.6, then to 0.7, and finally to 0.85.
* **Highlyknown:** Starts at approximately 0.6, increases to 0.8, then to 0.9, and finally to 0.95.
* **Refusal Rate Chart (top-right):**
* **Unknown:** Starts at approximately 0.02, increases to 0.1, then to 0.15, and finally to 0.2.
* **Weaklyknown:** Starts at approximately 0.01, increases sharply to 0.15, then to 0.2, and finally to 0.25.
* **Maybeknown:** Starts at approximately 0.01, increases to 0.05, then to 0.07, and finally to 0.1.
* **Highlyknown:** Starts at approximately 0.005, increases to 0.02, then to 0.03, and finally to 0.05.
**Chart (b) - LLaMA-3.1-8B on RGB<sub>en</sub>**
* **Accuracy Chart (bottom-left):**
* **Unknown:** Starts at approximately 0.1, increases to 0.2, then to 0.3, and finally to 0.4.
* **Weaklyknown:** Starts at approximately 0.15, increases to 0.3, then to 0.5, and finally to 0.6.
* **Maybeknown:** Starts at approximately 0.2, increases to 0.4, then to 0.6, and finally to 0.7.
* **Highlyknown:** Starts at approximately 0.3, increases to 0.5, then to 0.7, and finally to 0.8.
* **Refusal Rate Chart (bottom-right):**
* **Unknown:** Starts at approximately 0.01, increases to 0.03, then to 0.05, and finally to 0.07.
* **Weaklyknown:** Starts at approximately 0.005, increases to 0.02, then to 0.03, and finally to 0.05.
* **Maybeknown:** Starts at approximately 0.005, increases to 0.01, then to 0.02, and finally to 0.03.
* **Highlyknown:** Starts at approximately 0.002, increases to 0.005, then to 0.01, and finally to 0.015.
### Key Observations
* **Accuracy generally increases with more context chunks** for both models and all knowledge states.
* **Refusal rate generally increases with more context chunks**, but the increase is more pronounced for the "weaklyknown" category.
* **Qwen-2.5-7B (RGB<sub>zh</sub>) consistently exhibits higher accuracy** than LLaMA-3.1-8B (RGB<sub>en</sub>) across all knowledge states and context chunk levels.
* **LLaMA-3.1-8B (RGB<sub>en</sub>) consistently exhibits lower refusal rates** than Qwen-2.5-7B (RGB<sub>zh</sub>) across all knowledge states and context chunk levels.
* The "highlyknown" category consistently has the highest accuracy and lowest refusal rate for both models.
### Interpretation
The data suggests that providing more context chunks improves the answer accuracy of both language models. However, it also increases the refusal rate, particularly for information that is only "weakly known." This indicates a trade-off between accuracy and safety – the models become more confident in their answers with more context, but also more likely to refuse to answer if the information is uncertain.
The differences between Qwen-2.5-7B and LLaMA-3.1-8B could be attributed to several factors, including differences in model architecture, training data, and the language they were trained on (Chinese vs. English). The higher accuracy of Qwen-2.5-7B on RGB<sub>zh</sub> might be due to its native language being Chinese, while the lower refusal rate of LLaMA-3.1-8B on RGB<sub>en</sub> could be a result of its training data or safety mechanisms.
The consistent performance of the "highlyknown" category suggests that the models are most reliable when dealing with information they have a strong understanding of. The increasing refusal rate for "weaklyknown" information highlights the importance of carefully evaluating the source and reliability of information before relying on language model outputs. The arrows visually emphasize the trends, showing a clear positive correlation between context chunks and accuracy, and a positive correlation between context chunks and refusal rate.