## Line Chart: EGA vs. Environment Step for Different Numbers of Goals
### Overview
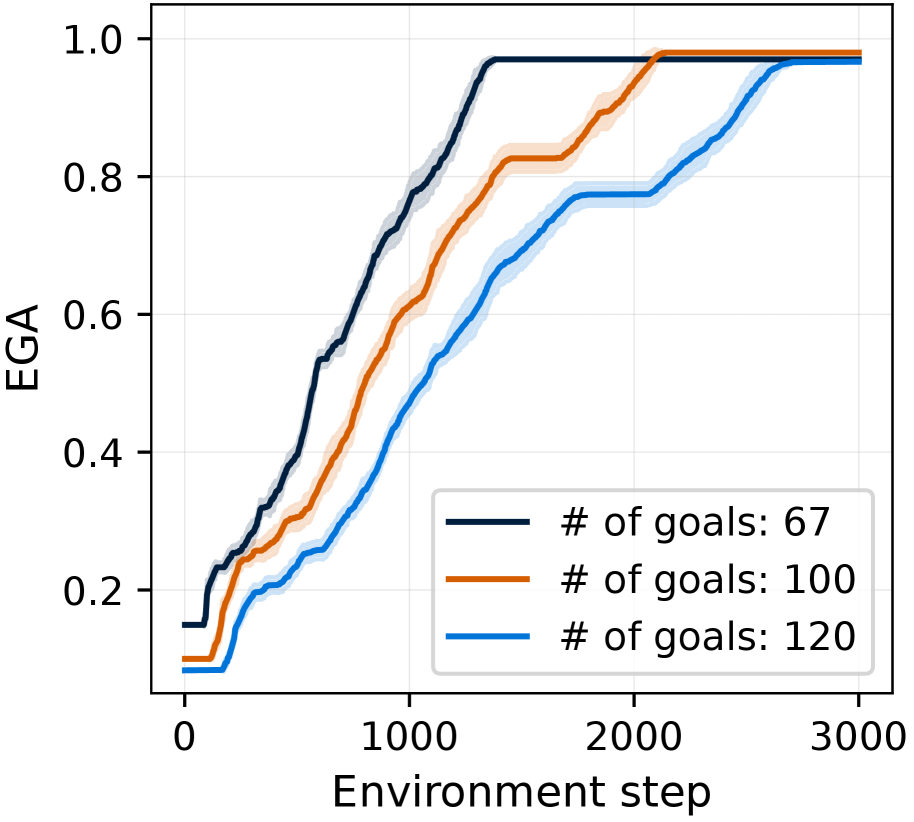
The image is a line chart comparing the EGA (likely standing for Environment Goal Achievement) against the Environment Step for three different scenarios, each representing a different number of goals: 67, 100, and 120. The chart shows how the EGA changes as the environment step increases for each of these goal settings. Each line has a shaded region around it, indicating the variance or uncertainty in the data.
### Components/Axes
* **X-axis:** "Environment step" ranging from 0 to 3000, with tick marks at 0, 1000, 2000, and 3000.
* **Y-axis:** "EGA" (Environment Goal Achievement) ranging from 0.0 to 1.0, with tick marks at 0.2, 0.4, 0.6, 0.8, and 1.0.
* **Legend:** Located in the bottom-right corner, it identifies the three lines by the number of goals:
* Dark Blue line: "# of goals: 67"
* Orange line: "# of goals: 100"
* Blue line: "# of goals: 120"
### Detailed Analysis
* **Dark Blue Line (# of goals: 67):**
* Trend: The line generally slopes upward, indicating an increase in EGA as the environment step increases. It starts at approximately 0.1 and reaches a plateau near 1.0 around environment step 2000.
* Data Points:
* Environment step 0: EGA ~0.1
* Environment step 500: EGA ~0.6
* Environment step 1000: EGA ~0.8
* Environment step 2000: EGA ~0.98
* Environment step 3000: EGA ~0.98
* **Orange Line (# of goals: 100):**
* Trend: The line also slopes upward, but it appears to increase more gradually than the dark blue line. It starts at approximately 0.1 and reaches a plateau near 0.98 around environment step 2500.
* Data Points:
* Environment step 0: EGA ~0.1
* Environment step 500: EGA ~0.4
* Environment step 1000: EGA ~0.65
* Environment step 2000: EGA ~0.85
* Environment step 3000: EGA ~0.98
* **Blue Line (# of goals: 120):**
* Trend: The line slopes upward, starting slower than the other two, and plateaus last. It starts at approximately 0.08 and reaches a plateau near 0.98 around environment step 3000.
* Data Points:
* Environment step 0: EGA ~0.08
* Environment step 500: EGA ~0.3
* Environment step 1000: EGA ~0.45
* Environment step 2000: EGA ~0.75
* Environment step 3000: EGA ~0.98
### Key Observations
* The EGA generally increases with the environment step for all three scenarios.
* The dark blue line (# of goals: 67) reaches a high EGA value faster than the other two lines.
* The blue line (# of goals: 120) increases more slowly initially but eventually reaches a similar EGA value as the other two.
* All three lines plateau near an EGA of 1.0, indicating that the environment goal is eventually achieved in all scenarios.
* The shaded regions around each line suggest some variability in the EGA at each environment step, but the overall trends are consistent.
### Interpretation
The chart suggests that the number of goals in the environment affects the rate at which the environment goal is achieved. With fewer goals (67), the EGA increases more rapidly, indicating faster learning or achievement. As the number of goals increases (100 and 120), the EGA increases more gradually, suggesting that it takes more environment steps to achieve the same level of performance. However, all three scenarios eventually reach a similar level of EGA, indicating that the environment goal can be achieved regardless of the number of goals, given enough environment steps. The shaded regions indicate that there is some variability in the EGA at each environment step, which could be due to factors such as randomness in the environment or the learning algorithm.