## Line Graph: EGA Convergence Across Environment Steps with Varying Goal Counts
### Overview
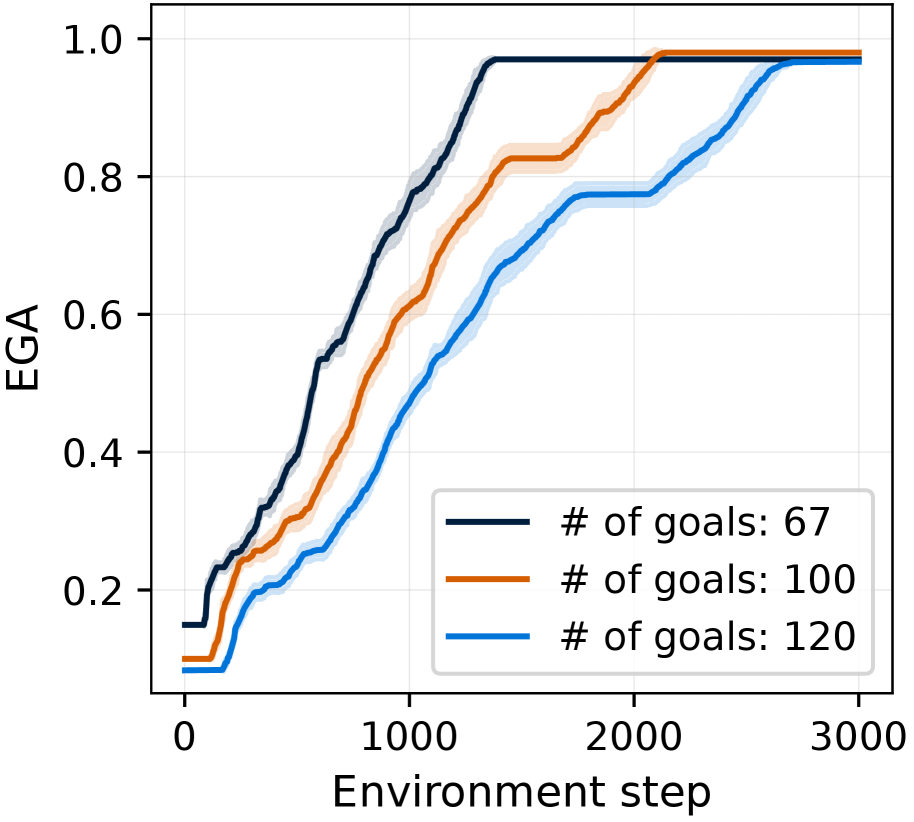
The graph illustrates the convergence of Expected Goal Achievement (EGA) over environment steps for three distinct goal counts: 67, 100, and 120. EGA is plotted on the y-axis (0.0–1.0), while environment steps (0–3000) are on the x-axis. Three colored lines represent each goal count, with shaded regions indicating confidence intervals.
### Components/Axes
- **X-axis**: "Environment step" (0 to 3000, linear scale).
- **Y-axis**: "EGA" (0.0 to 1.0, linear scale).
- **Legend**: Located in the bottom-right corner, mapping:
- Black line: `# of goals: 67`
- Orange line: `# of goals: 100`
- Blue line: `# of goals: 120`
- **Shaded Regions**: Gray (black line), light orange (orange line), light blue (blue line), representing 95% confidence intervals.
### Detailed Analysis
1. **Black Line (# of goals: 67)**:
- Starts at ~0.15 EGA at 0 steps.
- Rises sharply, reaching ~1.0 EGA by ~1,500 steps.
- Confidence interval narrows as EGA approaches 1.0.
2. **Orange Line (# of goals: 100)**:
- Begins at ~0.1 EGA at 0 steps.
- Gradual ascent, achieving ~1.0 EGA by ~2,000 steps.
- Confidence interval widens initially, then tightens near convergence.
3. **Blue Line (# of goals: 120)**:
- Starts at ~0.05 EGA at 0 steps.
- Slowest rise, reaching ~1.0 EGA by ~2,500 steps.
- Broadest confidence interval throughout, indicating higher variability.
### Key Observations
- **Convergence Speed**: Fewer goals (67) achieve higher EGA faster than more goals (100, 120).
- **Confidence Intervals**: Wider intervals for higher goal counts suggest greater uncertainty in performance.
- **Asymptotic Behavior**: All lines plateau near 1.0 EGA, but higher goal counts require more steps to reach this threshold.
### Interpretation
The data demonstrates an inverse relationship between the number of goals and the rate of EGA convergence. Systems with fewer goals (67) exhibit faster and more consistent improvement in EGA, while those with more goals (120) show slower progress and higher variability. This suggests that increasing goal complexity or quantity may require additional computational resources or algorithmic adjustments to maintain efficiency. The widening confidence intervals for higher goal counts imply that performance metrics become less predictable as task difficulty increases.