## Density Plot: Adult Census Income
### Overview
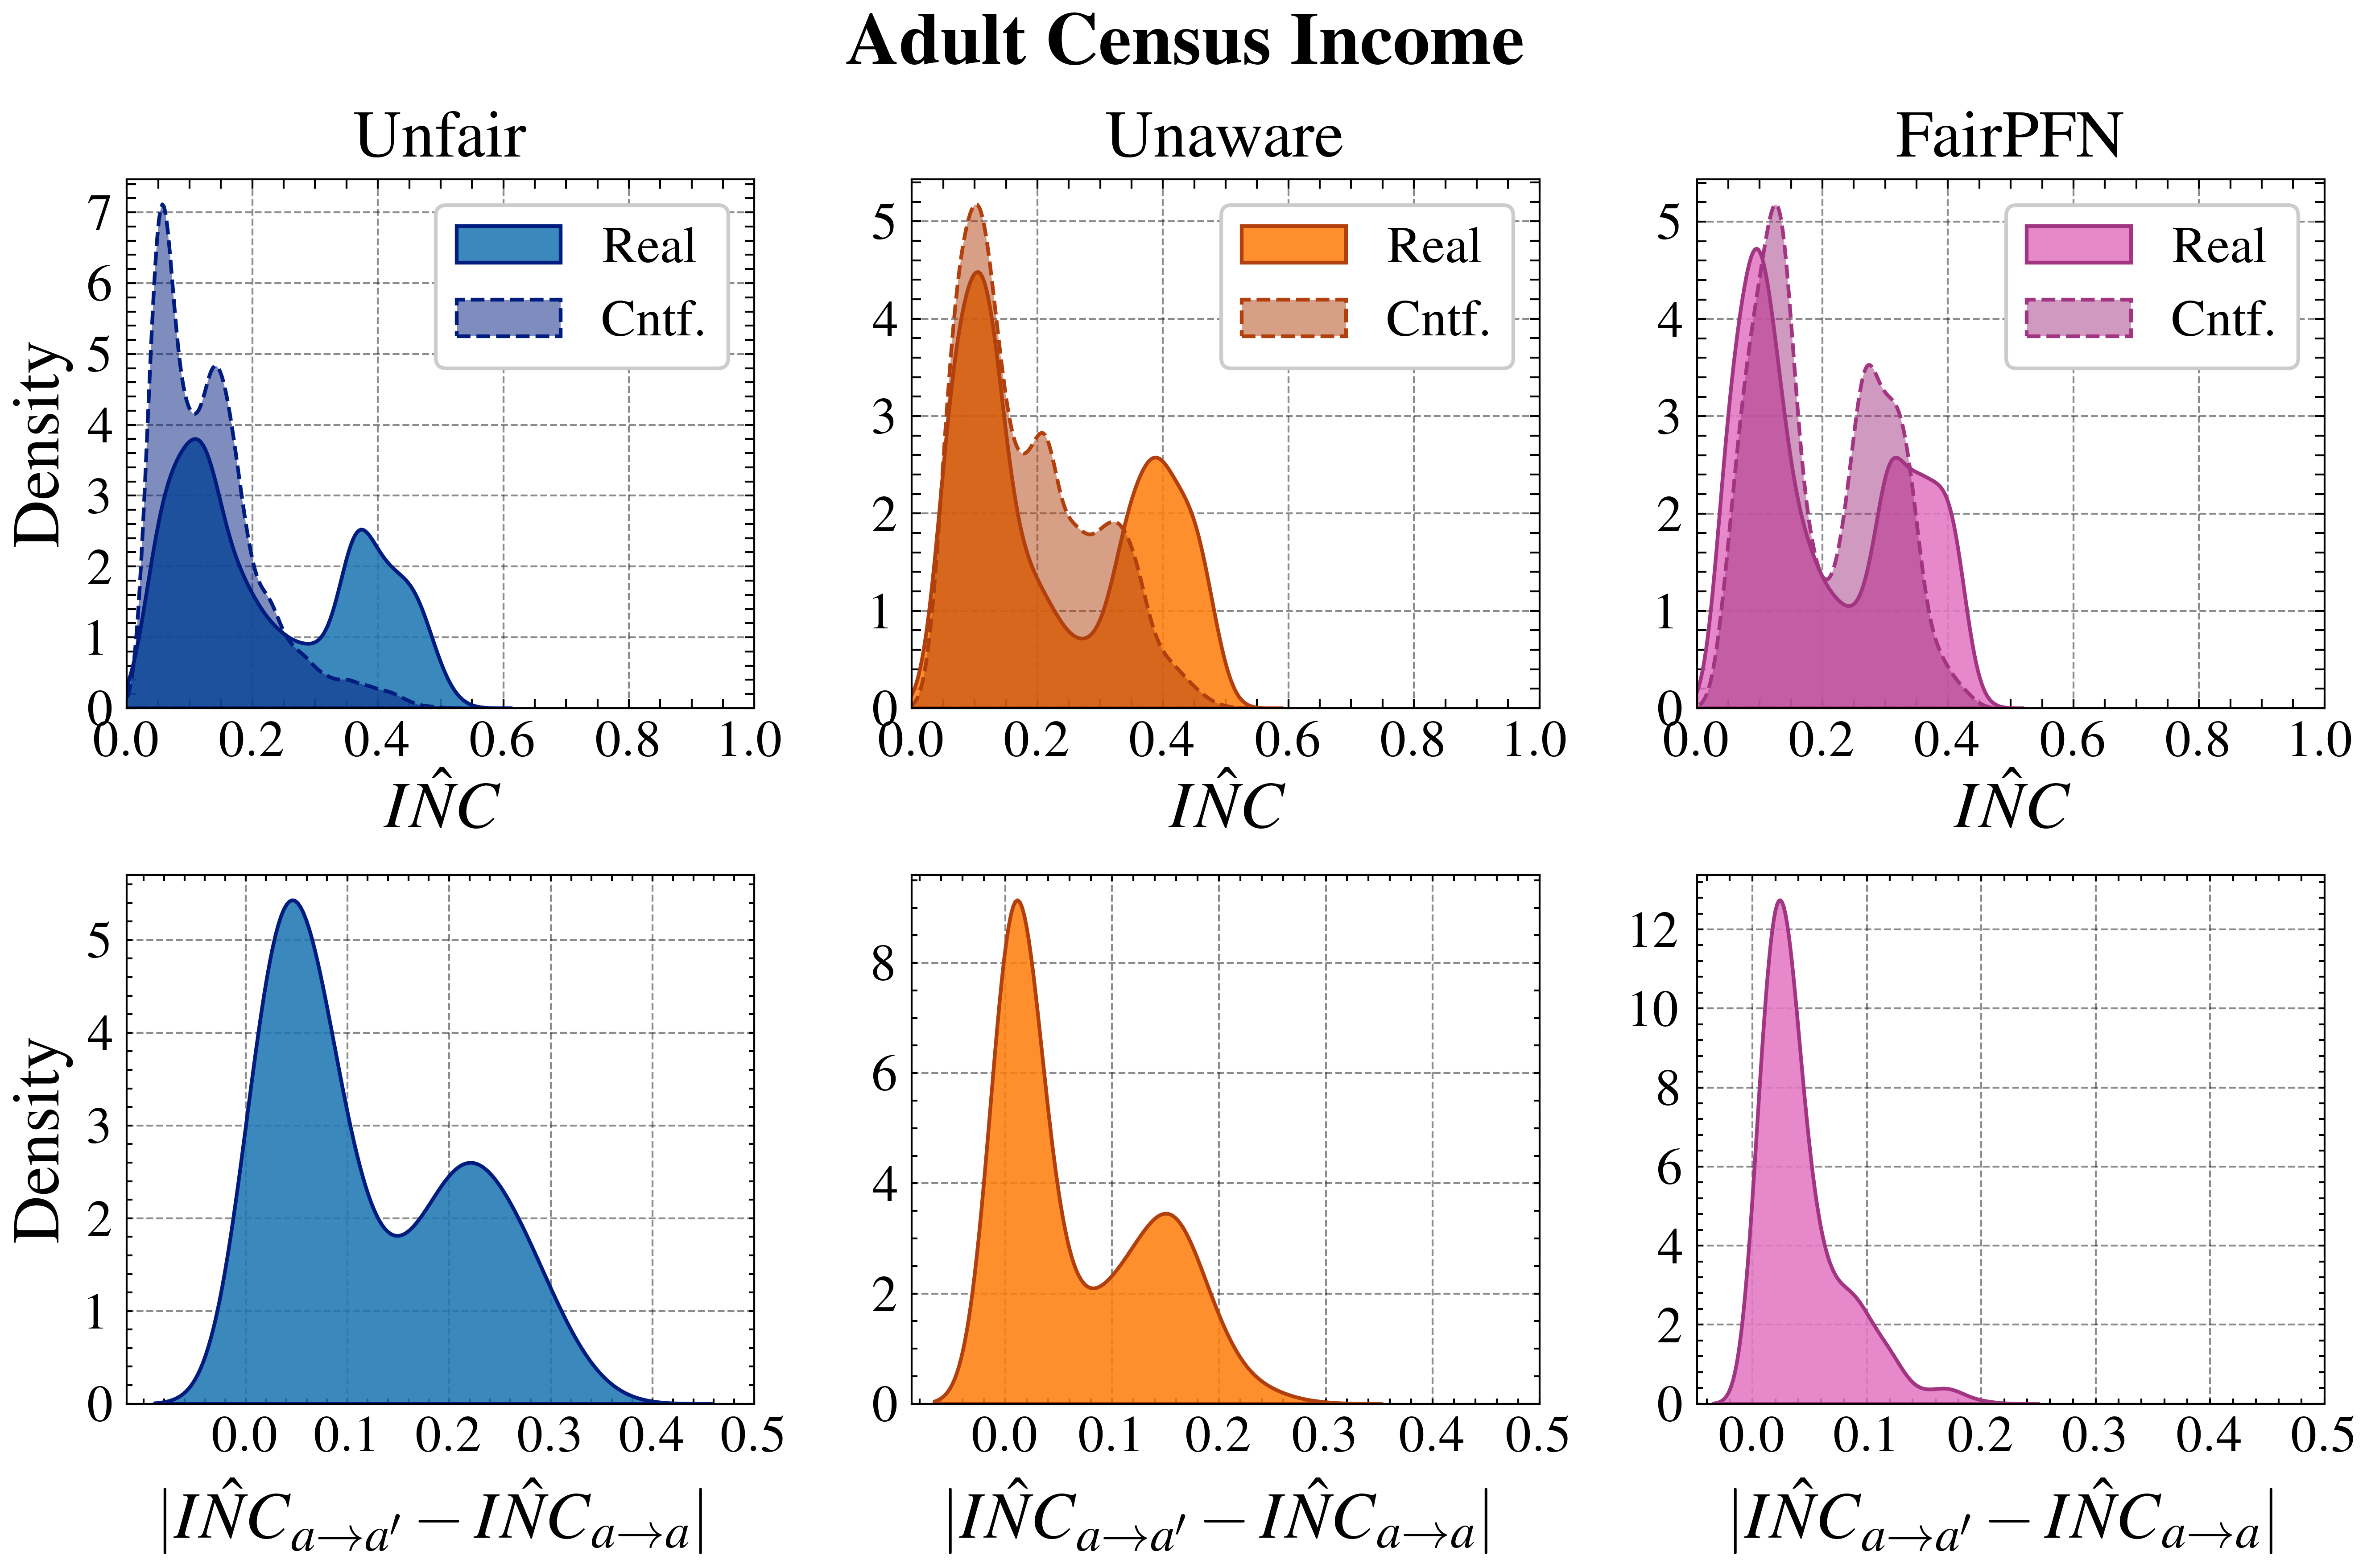
The image presents six density plots, arranged in a 2x3 grid, visualizing the distribution of income-related metrics for different fairness interventions on adult census data. The plots in the top row show the distribution of income (INC), while the bottom row shows the distribution of the absolute difference between income under different conditions. The columns represent different fairness interventions: "Unfair", "Unaware", and "FairPFN". Each plot displays two distributions: "Real" (actual data) and "Cntf." (counterfactual data).
### Components/Axes
**Overall Title:** Adult Census Income
**Top Row Plots:**
* **X-axis:** *IÑC* (Income), ranging from 0.0 to 1.0, with tick marks at intervals of 0.2.
* **Y-axis:** Density, ranging from 0 to 7 (Unfair), 0 to 5 (Unaware, FairPFN), with tick marks at intervals of 1.
* **Titles:** Unfair, Unaware, FairPFN
* **Legend:** Located in the top-right corner of each plot.
* "Real": Solid color fill (blue for Unfair, orange for Unaware, pink for FairPFN).
* "Cntf.": Dashed line with a lighter shade of the corresponding color.
**Bottom Row Plots:**
* **X-axis:** |*IÑC*<sub>a→a'</sub> - *IÑC*<sub>a→a</sub>| (Absolute difference in income), ranging from 0.0 to 0.5, with tick marks at intervals of 0.1.
* **Y-axis:** Density, ranging from 0 to 6 (Unfair), 0 to 9 (Unaware), 0 to 13 (FairPFN), with tick marks at intervals of 2.
### Detailed Analysis
**Top Row Plots:**
* **Unfair (Top-Left):**
* **Real (Blue):** The "Real" distribution has two peaks, one around 0.1 and another around 0.4. The density at 0.1 is approximately 3.7, and at 0.4 it is approximately 2.2.
* **Cntf. (Dashed Blue):** The "Cntf." distribution has a sharp peak around 0.0, reaching a density of approximately 7.0. It also has a smaller peak around 0.4, with a density of approximately 1.0.
* **Unaware (Top-Middle):**
* **Real (Orange):** The "Real" distribution has a peak around 0.1, with a density of approximately 3.0, and a broader peak around 0.4, with a density of approximately 2.5.
* **Cntf. (Dashed Orange):** The "Cntf." distribution has a peak around 0.1, with a density of approximately 5.0.
* **FairPFN (Top-Right):**
* **Real (Pink):** The "Real" distribution has two peaks, one around 0.1 and another around 0.3. The density at 0.1 is approximately 5.0, and at 0.3 it is approximately 2.5.
* **Cntf. (Dashed Pink):** The "Cntf." distribution has two peaks, one around 0.1 and another around 0.3. The density at 0.1 is approximately 5.0, and at 0.3 it is approximately 3.5.
**Bottom Row Plots:**
* **Unfair (Bottom-Left):** The distribution has two peaks, one around 0.05 and another around 0.25. The density at 0.05 is approximately 5.2, and at 0.25 it is approximately 2.5.
* **Unaware (Bottom-Middle):** The distribution has two peaks, one around 0.05 and another around 0.15. The density at 0.05 is approximately 9.0, and at 0.15 it is approximately 3.2.
* **FairPFN (Bottom-Right):** The distribution has a single sharp peak around 0.05, with a density of approximately 12.5.
### Key Observations
* The "Cntf." distributions in the top row tend to have a higher density near 0.0 compared to the "Real" distributions, especially for the "Unfair" intervention.
* The "FairPFN" intervention results in a bottom row distribution that is highly concentrated around 0.0, indicating a smaller difference in income under different conditions.
* The "Unaware" intervention shows a higher density in the bottom row plots compared to the "Unfair" intervention, suggesting a larger difference in income under different conditions.
### Interpretation
The plots compare the income distributions under different fairness interventions. The top row shows the distribution of income itself, while the bottom row shows the distribution of the absolute difference in income under different conditions. The "Unfair" intervention represents the baseline scenario without any fairness considerations. The "Unaware" intervention likely represents a scenario where fairness is not explicitly addressed in the model. The "FairPFN" intervention represents a scenario where a fairness-aware algorithm (likely based on counterfactual reasoning) is used.
The data suggests that the "FairPFN" intervention is more effective in reducing the difference in income under different conditions, as evidenced by the high concentration of the distribution around 0.0 in the bottom-right plot. This indicates that the algorithm is successful in mitigating unfairness by making the income more consistent across different conditions. The "Unaware" intervention, on the other hand, appears to exacerbate the difference in income, as shown by the higher density in the bottom-middle plot. The "Unfair" intervention falls somewhere in between, with a moderate difference in income.
The shift in the "Cntf." distributions towards 0.0 in the top row plots, particularly for the "Unfair" intervention, suggests that the counterfactual reasoning is identifying and correcting for biases that lead to lower income predictions.