## Scatter Plot: Relationship Between Non-Embedding Training FLOPs and Optimal Batch Size
### Overview
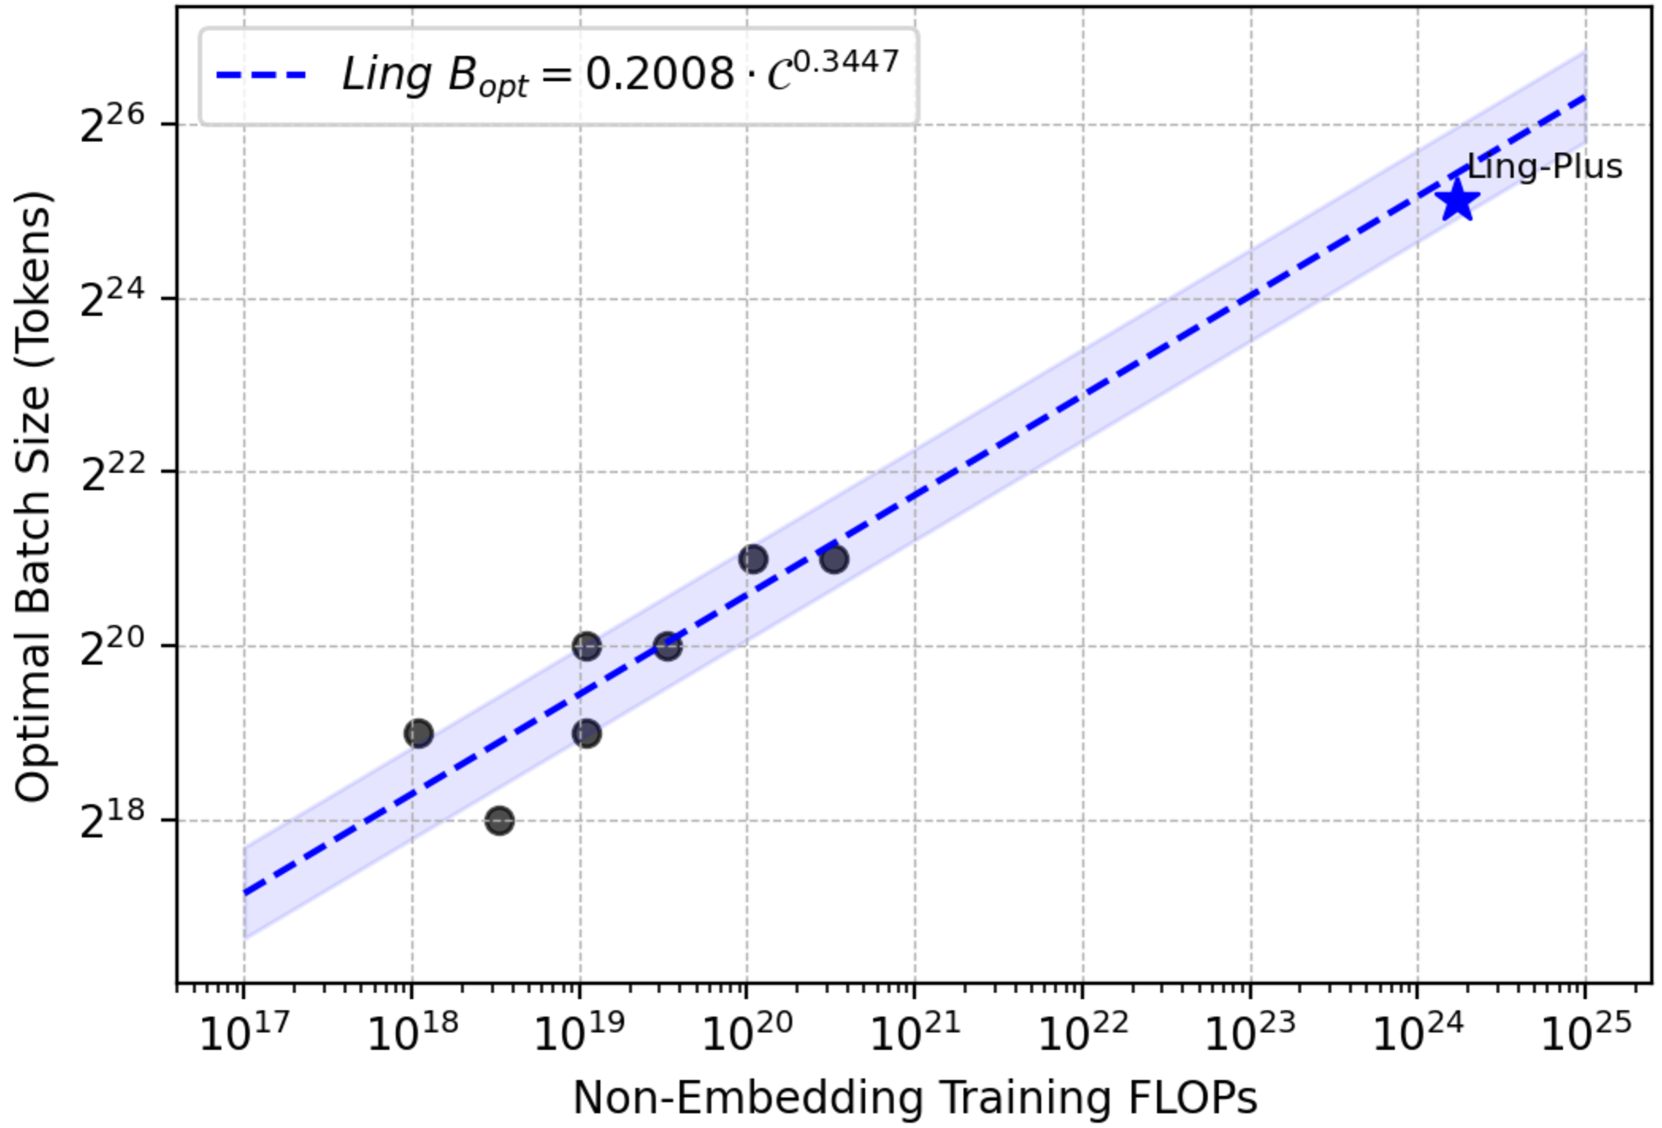
The image is a logarithmic scatter plot showing the relationship between non-embedding training FLOPs (x-axis) and optimal batch size (tokens, y-axis). A dashed blue line represents a power-law trend, with a shaded region indicating uncertainty. A star labeled "Ling-Plus" is plotted near the upper-right corner, deviating from the trend.
### Components/Axes
- **X-axis**: "Non-Embedding Training FLOPs" (logarithmic scale, 10¹⁷ to 10²⁵)
- **Y-axis**: "Optimal Batch Size (Tokens)" (logarithmic scale, 2¹⁸ to 2²⁶)
- **Legend**: Located in the top-left corner, labeled "Ling B_opt = 0.2008 · C⁰.³⁴⁴⁷" (blue dashed line).
- **Data Points**: Black dots scattered along the trend line.
- **Star Marker**: A single blue star labeled "Ling-Plus" at (10²⁴, ~2²⁵).
### Detailed Analysis
- **Trend Line**: The dashed blue line follows a power-law relationship, with the equation explicitly stated in the legend. The slope (0.3447) indicates a sublinear growth of batch size with increasing FLOPs.
- **Shaded Region**: A light blue band around the trend line suggests a confidence interval or prediction uncertainty.
- **Data Points**: Black dots are distributed along the trend line, with some variability. For example:
- At 10¹⁸ FLOPs, batch sizes range from ~2¹⁸ to 2¹⁹.
- At 10²⁰ FLOPs, batch sizes cluster around 2²⁰–2²¹.
- **Star Marker**: The "Ling-Plus" point (10²⁴ FLOPs, ~2²⁵ tokens) lies above the trend line, indicating an outlier or a specific benchmark.
### Key Observations
1. **Power-Law Relationship**: The trend line confirms that optimal batch size scales with FLOPs according to the equation, with a moderate exponent (0.3447).
2. **Outlier**: "Ling-Plus" deviates significantly from the trend, suggesting either a unique model architecture or an anomaly in the dataset.
3. **Logarithmic Scaling**: Both axes use logarithmic scales, emphasizing exponential growth patterns in the data.
### Interpretation
The plot demonstrates that larger models (higher FLOPs) require proportionally larger batch sizes, but the relationship is sublinear. The "Ling-Plus" point highlights a potential exception, possibly indicating a model optimized for specific hardware or training constraints. The shaded region underscores the uncertainty in predicting batch sizes for extreme FLOP values, emphasizing the need for further validation at the upper end of the scale. The logarithmic axes reveal that the relationship is more pronounced at smaller FLOP scales, with diminishing returns at higher scales.