## Density Plot: Counterfactual Fairness Audit for Attribute "hisp"
### Overview
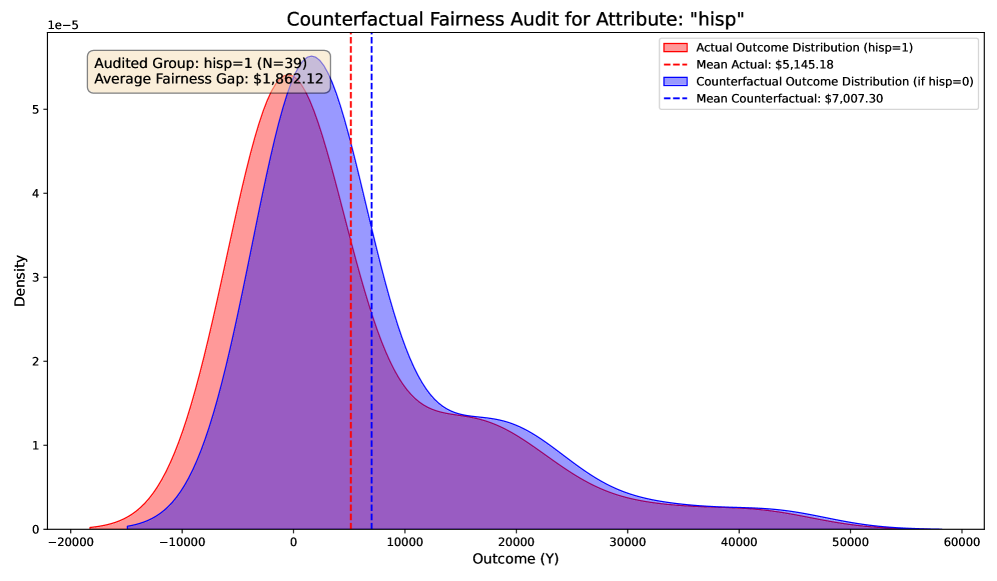
The image is a density plot comparing the actual outcome distribution for a group where "hisp=1" (Hispanic) with the counterfactual outcome distribution if "hisp=0". It visualizes the fairness gap between these two distributions, showing the difference in outcomes based on the "hisp" attribute. The plot includes mean values for both distributions and highlights the average fairness gap.
### Components/Axes
* **Title:** Counterfactual Fairness Audit for Attribute: "hisp"
* **X-axis:** Outcome (Y), ranging from -20000 to 60000.
* **Y-axis:** Density, ranging from 0 to 5e-5.
* **Legend (Top-Right):**
* Red: Actual Outcome Distribution (hisp=1)
* Red Dashed Line: Mean Actual: $5,145.18
* Blue: Counterfactual Outcome Distribution (if hisp=0)
* Blue Dashed Line: Mean Counterfactual: $7,007.30
* **Annotation (Top-Left):** Audited Group: hisp=1 (N=39), Average Fairness Gap: $1,862.12
### Detailed Analysis
* **Actual Outcome Distribution (hisp=1) - Red:**
* Trend: The red curve represents the density of the actual outcome distribution when hisp=1. It peaks around 0 and then decreases as the outcome increases or decreases.
* Mean Actual (Red Dashed Line): $5,145.18. The red dashed line is positioned at approximately x=5000.
* **Counterfactual Outcome Distribution (if hisp=0) - Blue:**
* Trend: The blue curve represents the density of the counterfactual outcome distribution if hisp=0. It peaks slightly to the right of the red curve's peak and has a broader spread.
* Mean Counterfactual (Blue Dashed Line): $7,007.30. The blue dashed line is positioned at approximately x=7000.
### Key Observations
* The counterfactual outcome distribution (blue) is shifted to the right compared to the actual outcome distribution (red), indicating a higher average outcome when hisp=0.
* The average fairness gap is $1,862.12, which is the difference between the mean counterfactual outcome and the mean actual outcome.
* The actual outcome distribution (red) has a higher peak than the counterfactual outcome distribution (blue), suggesting a higher concentration of outcomes around its mean.
### Interpretation
The density plot illustrates a fairness issue related to the "hisp" attribute. The shift in the counterfactual distribution suggests that individuals with "hisp=1" experience, on average, lower outcomes compared to what they would experience if "hisp=0". The average fairness gap of $1,862.12 quantifies this disparity. This analysis suggests potential bias or unfairness in the system being audited, where the "hisp" attribute is correlated with a difference in outcome. The plot provides a visual and quantitative assessment of this fairness gap, highlighting the need for further investigation and potential mitigation strategies.