\n
## Density Plot: Counterfactual Fairness Audit for Attribute "hisp"
### Overview
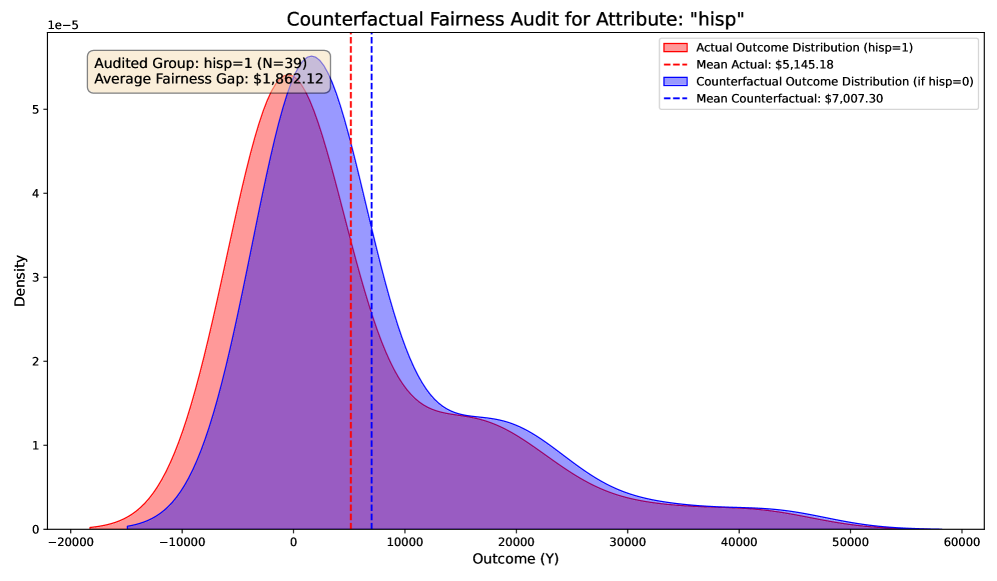
The image presents a density plot comparing the distribution of actual outcomes versus counterfactual outcomes for a group identified by the attribute "hisp". The plot is used to assess fairness, specifically the average fairness gap. The plot shows two overlapping density curves, one representing the actual outcome distribution and the other representing the counterfactual outcome distribution. Vertical dashed lines indicate the mean values for each distribution.
### Components/Axes
* **Title:** "Counterfactual Fairness Audit for Attribute “hisp”" (Top-center)
* **X-axis:** "Outcome (Y)" - Scale ranges from approximately -20000 to 60000.
* **Y-axis:** "Density" - Scale ranges from 0 to 6e-5.
* **Legend:** Located in the top-right corner.
* "Actual Outcome Distribution (hisp=1)" - Represented by a solid red fill.
* "Counterfactual Outcome Distribution (if hisp=0)" - Represented by a solid purple fill.
* "Mean Actual: $5,145.18" - Represented by a dashed red line.
* "Mean Counterfactual: $7,007.30" - Represented by a dashed blue line.
* **Audited Group Information:** "Audited Group: hisp=1 (N=39)" (Top-left)
* **Average Fairness Gap:** "$1,862.12" (Top-left, within a red box)
### Detailed Analysis
The plot displays two density curves.
* **Actual Outcome Distribution (hisp=1):** The red curve is centered around approximately 5000, with a long tail extending towards negative values. The density is highest around 0, decreasing as you move away in either direction. The mean actual outcome is indicated by a vertical dashed red line at approximately 5145.
* **Counterfactual Outcome Distribution (if hisp=0):** The purple curve is centered around approximately 7000, with a similar shape to the red curve, but shifted to the right. The density is highest around 0, decreasing as you move away in either direction. The mean counterfactual outcome is indicated by a vertical dashed blue line at approximately 7007.
The distributions overlap significantly, but the counterfactual distribution is shifted to the right, indicating a higher average outcome when the "hisp" attribute is set to 0.
### Key Observations
* The counterfactual mean ($7,007.30) is higher than the actual mean ($5,145.18).
* The average fairness gap is $1,862.12, representing the difference between the counterfactual and actual means.
* Both distributions are skewed to the left, with longer tails on the negative side.
* The sample size for the audited group is 39 (N=39).
### Interpretation
The data suggests a potential fairness concern related to the "hisp" attribute. The counterfactual analysis reveals that, on average, individuals would have a higher outcome if they did not belong to the "hisp" group. The fairness gap of $1,862.12 quantifies this difference.
The density plot visually demonstrates the shift in outcome distributions, highlighting the disparity. The overlap between the distributions indicates that there is still some variability within each group, but the overall trend suggests a systematic difference in outcomes based on the "hisp" attribute.
The fact that both distributions are skewed suggests that there are a number of individuals with significantly lower outcomes, potentially indicating a vulnerability within the system. The relatively small sample size (N=39) should be considered when interpreting these results; a larger sample size would provide more statistical power.
This analysis is a starting point for further investigation into the potential sources of unfairness and the development of mitigation strategies.