## Heatmap: Kendall's Correlation Coefficient Across Benchmarks
### Overview
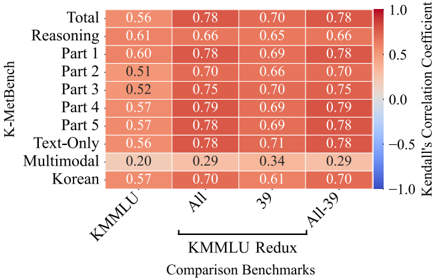
This heatmap visualizes Kendall's correlation coefficients between various benchmarks (rows) and comparison benchmarks (columns). The color gradient ranges from blue (-1.0) to red (1.0), indicating negative to positive correlation strength. Numerical values are embedded in each cell.
### Components/Axes
- **X-axis (Columns)**:
- `KMMMLU Redux` (subcategories: `All`, `39`, `All-39`)
- **Y-axis (Rows)**:
- `Total`, `Reasoning`, `Part 1-5`, `Text-Only`, `Multimodal`, `Korean`
- **Legend**:
- Color scale from blue (-1.0) to red (1.0), labeled "Kendall's Correlation Coefficient"
- **Title**:
- "Kendall's Correlation Coefficient"
### Detailed Analysis
- **K-MetBench**:
- Values: `0.56` (All), `0.78` (39), `0.70` (All-39)
- Trend: Strong positive correlation across all subcategories.
- **Reasoning**:
- Values: `0.61` (All), `0.66` (39), `0.65` (All-39)
- Trend: Moderate positive correlation, slightly lower than K-MetBench.
- **Part 1-5**:
- Values: `0.60-0.79` (All), `0.65-0.70` (39), `0.66-0.78` (All-39)
- Trend: Consistently high correlations, with Part 4 showing the highest (`0.79`).
- **Text-Only**:
- Values: `0.56` (All), `0.78` (39), `0.71` (All-39)
- Trend: Strong correlation, particularly in `39` and `All-39`.
- **Multimodal**:
- Values: `0.20` (All), `0.29` (39), `0.34` (All-39)
- Trend: Weak positive correlation, significantly lower than other benchmarks.
- **Korean**:
- Values: `0.57` (All), `0.70` (39), `0.61` (All-39)
- Trend: Moderate correlation, with a dip in `All-39`.
### Key Observations
1. **High Correlation**:
- `K-MetBench`, `Part 4`, and `Text-Only` show the strongest correlations (`≥0.70`), suggesting alignment with comparison benchmarks.
2. **Low Correlation**:
- `Multimodal` has the weakest correlation (`0.20-0.34`), indicating divergence from comparison benchmarks.
3. **Subcategory Variance**:
- `All-39` generally shows lower correlations than `All` or `39` (e.g., `Korean` drops from `0.70` to `0.61`).
4. **Color Consistency**:
- All values align with the legend (e.g., `0.79` is dark red, `0.20` is light red).
### Interpretation
- **Benchmark Effectiveness**:
- High correlations for `K-MetBench` and its components suggest they are robust proxies for the comparison benchmarks.
- **Multimodal Anomaly**:
- The low correlation for `Multimodal` may reflect challenges in integrating multiple modalities (e.g., text, images) compared to text-only benchmarks.
- **Language-Specific Trends**:
- The `Korean` row shows mixed performance, potentially due to language-specific nuances or dataset biases.
- **Subset Impact**:
- The `All-39` column reveals reduced correlations across most benchmarks, implying that the `39` subset may not fully capture the broader benchmark characteristics.
This heatmap highlights the importance of benchmark design in capturing domain-specific traits, with `Multimodal` and `Korean` requiring further investigation for alignment with standard benchmarks.