## Violin Plot: High School Biology Accuracy by LLM Configuration
### Overview
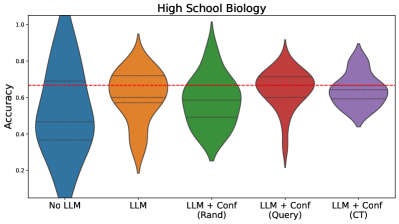
The image is a violin plot comparing the distribution of accuracy scores for five different configurations of a Large Language Model (LLM) system on a "High School Biology" task. A violin plot combines a box plot (showing median and interquartile range) with a kernel density plot (showing the probability density of the data at different values). The plot visualizes how the central tendency and spread of accuracy vary across the configurations.
### Components/Axes
* **Chart Title:** "High School Biology" (centered at the top).
* **Y-Axis:**
* **Label:** "Accuracy" (rotated vertically on the left side).
* **Scale:** Linear scale from 0.0 to 1.0.
* **Tick Marks:** Major ticks at 0.0, 0.2, 0.4, 0.6, 0.8, and 1.0.
* **X-Axis:**
* **Categories (from left to right):**
1. "No LLM"
2. "LLM"
3. "LLM + Conf (Rand)"
4. "LLM + Conf (Query)"
5. "LLM + Conf (CT)"
* **Reference Line:** A horizontal red dashed line is drawn across the plot at the y-axis value of **0.7**.
* **Legend:** There is no separate legend box. The five categories on the x-axis serve as the legend, each associated with a distinct colored violin plot.
* "No LLM": Blue
* "LLM": Orange
* "LLM + Conf (Rand)": Green
* "LLM + Conf (Query)": Red
* "LLM + Conf (CT)": Purple
### Detailed Analysis
Each violin plot shows the distribution of accuracy scores for its category. The width of the violin at a given y-value represents the density (frequency) of data points at that accuracy level. Inside each violin, a thin black line represents the interquartile range (IQR), and a white dot or small horizontal line represents the median.
1. **No LLM (Blue):**
* **Trend/Shape:** The distribution is heavily skewed towards lower accuracy. It is widest (has the highest density) between approximately 0.2 and 0.5, with a long, thin tail extending up to ~0.9.
* **Key Values (Approximate):** Median appears to be around **0.45**. The bulk of the data (IQR) lies between ~0.3 and ~0.65. The range spans from near 0.0 to ~0.9.
2. **LLM (Orange):**
* **Trend/Shape:** The distribution is more symmetric and centered higher than "No LLM". It is widest around 0.6-0.8, indicating most scores cluster in this range.
* **Key Values (Approximate):** Median is approximately **0.7**. The IQR is roughly between 0.6 and 0.8. The range is from ~0.2 to ~0.95.
3. **LLM + Conf (Rand) (Green):**
* **Trend/Shape:** This distribution is tall and relatively narrow, indicating high variance but with a central peak. It is widest around 0.6-0.8, similar to "LLM", but with a more pronounced peak and longer tails.
* **Key Values (Approximate):** Median is near **0.7**. The IQR spans from ~0.55 to ~0.8. The range is very wide, from ~0.1 to nearly 1.0.
4. **LLM + Conf (Query) (Red):**
* **Trend/Shape:** The distribution is wide in the middle (0.6-0.8) but has a very long, thin tail extending down to low accuracy scores, suggesting a subset of poor performances.
* **Key Values (Approximate):** Median is around **0.7**. The IQR is between ~0.6 and ~0.8. The range is extensive, from ~0.1 to ~0.95.
5. **LLM + Conf (CT) (Purple):**
* **Trend/Shape:** This is the most compact and highest-performing distribution. It is widest between 0.7 and 0.85, with a shorter tail extending downward compared to the other "Conf" methods.
* **Key Values (Approximate):** Median is the highest, approximately **0.78**. The IQR is tight, between ~0.7 and ~0.85. The range is from ~0.4 to ~0.9.
### Key Observations
* **Performance Hierarchy:** The "LLM + Conf (CT)" configuration shows the highest median accuracy and the most consistent performance (narrowest IQR). "No LLM" has the lowest median and a distribution skewed toward failure.
* **Effect of LLM:** Simply adding an LLM ("LLM" category) dramatically shifts the entire distribution upward compared to "No LLM".
* **Effect of Confidence Calibration ("Conf"):** All three "Conf" methods maintain a median accuracy around or above the 0.7 reference line. However, they introduce greater variance (wider ranges) compared to the base "LLM" configuration, particularly in the lower tails.
* **Variance Comparison:** "LLM + Conf (Rand)" and "LLM + Conf (Query)" exhibit the largest spreads, with minimum scores near 0.1. "LLM + Conf (CT)" has a higher floor (~0.4).
* **Reference Line:** The red dashed line at 0.7 serves as a visual benchmark. The medians of all LLM-based configurations are at or above this line, while the "No LLM" median is well below it.
### Interpretation
This chart demonstrates the impact of different AI assistance strategies on high school biology task accuracy.
* **Baseline vs. AI Assistance:** The stark contrast between "No LLM" and all other categories provides strong evidence that using an LLM significantly improves performance on this task. The "No LLM" distribution suggests that without AI, performance is highly variable and often poor.
* **Calibration Trade-offs:** Adding confidence calibration ("Conf") to the LLM does not consistently improve the *median* score over the base "LLM" but appears to alter the *distribution* of outcomes. The "Rand" and "Query" methods seem to introduce instability, leading to both high and very low scores. This could indicate that these calibration methods are sometimes helpful but other times detrimental, perhaps due to overconfidence or misguidance.
* **Superior Method:** The "LLM + Conf (CT)" method appears most effective. It not only achieves the highest median accuracy but also reduces the risk of very low scores (higher minimum), suggesting it is a more robust and reliable calibration technique for this domain.
* **The 0.7 Benchmark:** The red line likely represents a target proficiency threshold (e.g., a passing grade or human expert baseline). The data shows that while an unaided LLM often meets this threshold, adding the right calibration ("CT") makes meeting it more consistent.
In summary, the data suggests that for high school biology tasks, employing an LLM is highly beneficial, and using a specific confidence calibration method ("CT") can further optimize both the average performance and the reliability of the system.