## Violin Plot: High School Biology Model Accuracy Comparison
### Overview
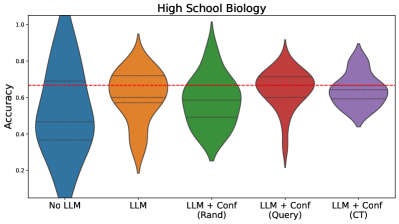
The image presents a comparative analysis of model accuracy distributions across five configurations in a high school biology context. Five colored violin plots represent different model setups, with a red dashed threshold line at 0.65 accuracy. The visualization emphasizes distributional characteristics (medians, quartiles, and spread) rather than just mean values.
### Components/Axes
- **X-axis**: Model configurations (categorical)
- No LLM (blue)
- LLM (orange)
- LLM + Conf (Rand) (green)
- LLM + Conf (Query) (red)
- LLM + Conf (CT) (purple)
- **Y-axis**: Accuracy metric (continuous, 0.0-1.0 scale)
- **Legend**: Color-coded model configurations (implicitly mapped)
- **Threshold line**: Red dashed horizontal line at 0.65 accuracy
### Detailed Analysis
1. **No LLM (blue)**:
- Wide distribution with heavy lower tail
- Median accuracy ~0.4 (black line)
- Interquartile range (IQR) spans 0.3-0.5
- Long tail extends to 0.8 but with low density
2. **LLM (orange)**:
- Symmetrical distribution centered ~0.6
- Median ~0.6 with IQR 0.5-0.7
- Moderate spread with slight right skew
3. **LLM + Conf (Rand) (green)**:
- Similar median to LLM (~0.6)
- Narrower IQR (0.55-0.65)
- More concentrated distribution than base LLM
4. **LLM + Conf (Query) (red)**:
- Highest median (~0.65)
- Tightest distribution (IQR 0.6-0.7)
- Significant portion above threshold line
5. **LLM + Conf (CT) (purple)**:
- Lowest median (~0.55)
- Bimodal distribution with peaks at 0.5 and 0.6
- Wide spread with heavy lower tail
### Key Observations
- **Threshold performance**: Only LLM + Conf (Query) shows substantial representation above the 0.65 threshold
- **Distribution characteristics**:
- No LLM exhibits highest variability (widest spread)
- LLM + Conf (CT) shows unusual bimodality
- Confidence mechanisms generally reduce spread but with mixed median effects
- **Color-legend alignment**: All colors match their respective categories without ambiguity
### Interpretation
The data suggests that:
1. **Confidence mechanisms improve consistency**: LLM + Conf variants show narrower distributions than base LLM, indicating more stable performance
2. **Query method optimization**: The Query configuration achieves highest median accuracy and best threshold penetration
3. **CT method limitations**: The CT configuration underperforms other variants despite confidence mechanisms
4. **Baseline performance**: No LLM shows poorest performance with highest variability
The visualization reveals that while confidence mechanisms generally improve model consistency, their effectiveness depends on implementation method. The Query approach demonstrates optimal balance between accuracy and reliability, while the CT method introduces unexpected performance degradation despite confidence integration. The red threshold line serves as a critical benchmark, showing that only one configuration consistently meets the 0.65 accuracy standard.