## 3D Grid Diagram: Numerical Distribution
### Overview
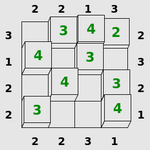
The image is a 3D grid diagram representing a 4x4 matrix. Each cell in the grid is represented by a stack of cubes, with the height of the stack indicated by a green number on the top cube. The diagram also includes numerical labels along the top, bottom, left, and right edges, indicating row and column indices or potentially some other associated value.
### Components/Axes
* **Grid:** A 4x4 grid structure formed by stacked cubes.
* **Cell Values:** Green numbers (3, 4, 2) displayed on the top cube of each stack, representing the height or value associated with that cell.
* **Edge Labels:** Numerical labels (1, 2, 3) along the top, bottom, left, and right edges of the grid.
### Detailed Analysis
The grid contains the following values in each cell:
* **Row 1:** 3, 4, 2
* **Row 2:** 4, 3
* **Row 3:** 4, 3
* **Row 4:** 3, 4
The edge labels are as follows:
* **Top:** 2, 2, 1, 3
* **Bottom:** 2, 2, 3, 1
* **Left:** 3, 1, 2, 2
* **Right:** 2, 3, 2, 1
### Key Observations
* The cell values range from 2 to 4.
* The edge labels range from 1 to 3.
* There is no clear pattern in the distribution of cell values or edge labels.
### Interpretation
The diagram represents a numerical distribution across a 4x4 grid. The cell values could represent various metrics, such as frequency, intensity, or magnitude. The edge labels could represent row and column indices, coordinates, or other associated attributes. Without additional context, it is difficult to determine the specific meaning of the values and labels. The diagram could be used to visualize data, represent a mathematical matrix, or illustrate a spatial distribution of values.