## 3D Grid Chart: Numerical Distribution in a 4x4 Matrix
### Overview
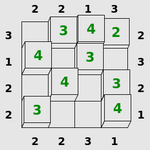
The image depicts a 3D grid structure with numerical values embedded in specific cells. The grid is organized as a 4x4 matrix, with some cells containing numbers (1, 2, 3, 4) in green text. The grid is framed by labeled axes on all four sides, with numerical markers indicating positions or categories. The 3D effect is achieved through shading and elevation of certain cells.
### Components/Axes
- **Axes Labels**:
- **Left Axis (Vertical)**: Labeled with values `3`, `1`, `2`, `2` (top to bottom).
- **Bottom Axis (Horizontal)**: Labeled with values `2`, `2`, `3`, `1` (left to right).
- **Right Axis (Vertical)**: Labeled with values `3`, `2`, `2`, `1` (top to bottom).
- **Top Axis (Horizontal)**: Labeled with values `2`, `2`, `1`, `3` (left to right).
- **Grid Structure**:
- A 4x4 matrix with cells containing numbers `1`, `2`, `3`, or `4`.
- Some cells are empty (no text).
- **Visual Elements**:
- Gray grid lines separating cells.
- Green numerical values in specific cells.
- 3D shading on cells to imply depth.
### Detailed Analysis
- **Cell Values**:
- **Row 1 (Top)**: Cells contain `3`, `4`, `2` (left to right).
- **Row 2**: Cells contain `4`, `3` (middle two cells).
- **Row 3**: Cells contain `4`, `3` (middle two cells).
- **Row 4 (Bottom)**: Cells contain `3`, `4` (left and right cells).
- **Axis Positioning**:
- The left and bottom axes are closer to the grid, while the right and top axes are offset outward.
- Axis labels are aligned with their respective axes but do not correspond to a clear numerical scale (e.g., left axis values `3`, `1`, `2`, `2` do not follow a sequential order).
### Key Observations
1. **Non-Uniform Distribution**: Numbers `1`, `2`, `3`, and `4` are distributed unevenly across the grid, with some cells left empty.
2. **3D Shading**: Cells with higher numerical values (e.g., `4`) appear more elevated, suggesting a potential correlation between value and depth.
3. **Axis Label Ambiguity**: The axes labels lack clear titles or units, making it difficult to interpret their meaning (e.g., whether they represent coordinates, categories, or scales).
### Interpretation
The grid likely represents a structured dataset or puzzle where numbers correspond to specific positions or categories. The 3D shading implies a hierarchical or layered relationship between values. However, the absence of axis titles and legends limits the ability to definitively interpret the data. Possible scenarios include:
- A **3D histogram** where axis labels represent bins or categories, and cell values indicate frequency or magnitude.
- A **puzzle or logic grid** where numbers must be placed according to rules (e.g., Sudoku-like constraints).
- A **spatial distribution map** where axes represent dimensions (e.g., x, y, z) and values denote measurements.
The irregular axis labels and empty cells suggest either incomplete data or a deliberate design choice for a specific analytical purpose. Further context is required to resolve ambiguities.