## Line Chart: Accuracy vs. #Sampled Reasoning Paths
### Overview
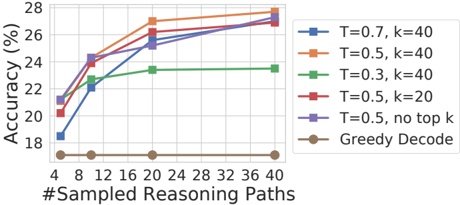
This image displays a line chart illustrating the relationship between the number of sampled reasoning paths (x-axis) and the resulting accuracy percentage (y-axis) for various decoding strategies used in a language model or reasoning system. The chart compares different combinations of Temperature ($T$) and top-$k$ sampling parameters, alongside a baseline "Greedy Decode" strategy.
### Components/Axes
* **X-Axis:** Labeled "#Sampled Reasoning Paths". The scale is linear, with major tick marks at 4, 8, 12, 16, 20, 24, 28, 32, 36, and 40.
* **Y-Axis:** Labeled "Accuracy (%)". The scale ranges from 18 to 28, with increments of 2.
* **Legend:** Positioned in the top-right quadrant of the chart area. It defines six distinct series:
* **Blue Square:** $T=0.7, k=40$
* **Orange Square:** $T=0.5, k=40$
* **Green Square:** $T=0.3, k=40$
* **Red Square:** $T=0.5, k=20$
* **Purple Square:** $T=0.5$, no top $k$
* **Brown Circle:** Greedy Decode
* **Data Points:** The data is plotted at four specific intervals on the x-axis: 4, 10 (estimated, between 8 and 12), 20, and 40.
### Detailed Analysis
The data series show the following trends and approximate values:
| Strategy | Trend Description | Accuracy at x=4 | Accuracy at x=10 | Accuracy at x=20 | Accuracy at x=40 |
| :--- | :--- | :--- | :--- | :--- | :--- |
| **Orange ($T=0.5, k=40$)** | Steep upward trend, flattening slightly at the end. | ~21.2% | ~24.2% | ~27.0% | ~27.8% |
| **Purple ($T=0.5$, no top $k$)** | Upward trend, similar to Orange but slightly lower. | ~21.2% | ~24.2% | ~25.2% | ~27.5% |
| **Red ($T=0.5, k=20$)** | Upward trend, slightly lower than Orange. | ~20.2% | ~24.0% | ~26.2% | ~26.8% |
| **Blue ($T=0.7, k=40$)** | Steepest upward trend; starts lowest, ends near top. | ~18.5% | ~22.0% | ~25.5% | ~27.2% |
| **Green ($T=0.3, k=40$)** | Upward trend, but plateaus significantly after x=20. | ~21.0% | ~22.5% | ~23.5% | ~23.5% |
| **Brown (Greedy)** | Flat line; no change regardless of sampling. | ~17.2% | ~17.2% | ~17.2% | ~17.2% |
### Key Observations
* **Greedy Baseline:** The "Greedy Decode" strategy (Brown) remains constant at approximately 17.2% accuracy, indicating that increasing the number of sampled reasoning paths does not affect this specific decoding method.