## Line Chart: Accuracy vs. Number of Sampled Reasoning Paths
### Overview
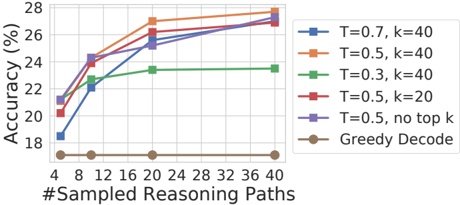
The image is a line chart comparing the performance (accuracy) of different model configurations as the number of sampled reasoning paths increases. The chart plots six distinct data series, each representing a unique combination of temperature (T) and top-k sampling parameters, or a baseline decoding method.
### Components/Axes
* **Chart Type:** Multi-series line chart with markers.
* **X-Axis:**
* **Label:** `#Sampled Reasoning Paths`
* **Scale:** Linear, from 4 to 40.
* **Tick Marks:** 4, 8, 12, 16, 20, 24, 28, 32, 36, 40.
* **Y-Axis:**
* **Label:** `Accuracy (%)`
* **Scale:** Linear, from 18 to 28.
* **Tick Marks:** 18, 20, 22, 24, 26, 28.
* **Legend:** Positioned on the right side of the chart, outside the plot area. It contains six entries, each with a colored line, a unique marker symbol, and a text label.
* **Grid:** Light gray horizontal and vertical grid lines are present.
### Detailed Analysis
**Legend and Series Identification (Right-side legend, top to bottom):**
1. **Blue line with square markers:** `T=0.7, k=40`
2. **Orange line with circle markers:** `T=0.5, k=40`
3. **Green line with upward-pointing triangle markers:** `T=0.3, k=40`
4. **Red line with downward-pointing triangle markers:** `T=0.5, k=20`
5. **Purple line with diamond markers:** `T=0.5, no top k`
6. **Brown line with pentagon markers:** `Greedy Decode`
**Data Point Extraction and Trend Verification:**
* **Trend for all lines except Greedy Decode:** All show a positive correlation between the number of sampled reasoning paths and accuracy. The slope is steepest between 4 and 12 paths, after which the rate of improvement generally slows (diminishing returns).
* **Trend for Greedy Decode (Brown):** The line is nearly flat, showing no improvement with more paths.
**Approximate Data Points (Accuracy % at each X value):**
| #Sampled Paths | T=0.7, k=40 (Blue) | T=0.5, k=40 (Orange) | T=0.3, k=40 (Green) | T=0.5, k=20 (Red) | T=0.5, no top k (Purple) | Greedy Decode (Brown) |
| :--- | :--- | :--- | :--- | :--- | :--- | :--- |
| **4** | ~18.2 | ~20.8 | ~21.0 | ~20.2 | ~21.2 | ~17.0 |
| **8** | ~22.2 | ~24.2 | ~22.2 | ~24.0 | ~24.2 | ~17.0 |
| **12** | ~23.8 | ~25.0 | ~23.2 | ~24.8 | ~24.8 | ~17.0 |
| **16** | ~25.2 | ~26.2 | ~23.4 | ~26.0 | ~25.8 | ~17.0 |
| **20** | ~25.8 | ~27.2 | ~23.5 | ~26.5 | ~26.2 | ~17.0 |
| **24** | ~26.5 | ~27.5 | ~23.5 | ~26.8 | ~26.8 | ~17.0 |
| **28** | ~27.0 | ~27.8 | ~23.5 | ~27.0 | ~27.0 | ~17.0 |
| **32** | ~27.2 | ~27.9 | ~23.5 | ~27.2 | ~27.2 | ~17.0 |
| **36** | ~27.4 | ~28.0 | ~23.5 | ~27.4 | ~27.4 | ~17.0 |
| **40** | ~27.5 | ~28.0 | ~23.5 | ~27.5 | ~27.5 | ~17.0 |
### Key Observations
1. **Performance Hierarchy:** The configuration `T=0.5, k=40` (Orange) consistently achieves the highest accuracy across all sampling counts, peaking at approximately 28%.
2. **Impact of Temperature (T):** For a fixed `k=40`, higher temperature leads to better performance. `T=0.7` (Blue) outperforms `T=0.5` (Orange), which in turn significantly outperforms `T=0.3` (Green). The `T=0.3` line shows the least improvement and plateaus early.
3. **Impact of Top-k:** For a fixed `T=0.5`, using a larger top-k (`k=40`, Orange) yields better results than a smaller top-k (`k=20`, Red). Removing the top-k filter entirely (`no top k`, Purple) performs very similarly to `k=20`, and slightly worse than `k=40`.
4. **Greedy Decode Baseline:** The `Greedy Decode` method (Brown) serves as a low-performance baseline, showing no benefit from increased sampling and remaining at ~17% accuracy.
5. **Diminishing Returns:** All sampling-based methods show a clear "knee" in their curves around 12-20 sampled paths, after which additional paths yield progressively smaller gains in accuracy.
### Interpretation
This chart demonstrates the effectiveness of **sampling-based reasoning** (e.g., using techniques like majority voting or best-of-n selection) over deterministic greedy decoding for improving model accuracy on a given task. The data suggests that:
* **Exploration is Key:** Allowing the model to explore multiple reasoning paths (sampling) is fundamentally better than committing to a single, greedy path. The flat brown line indicates that simply repeating the greedy decode does not help.
* **Balancing Creativity and Coherence:** The temperature parameter (`T`) controls the randomness of sampling. A higher temperature (`T=0.7`) encourages more diverse, creative reasoning paths, which in this case leads to higher final accuracy when aggregated. However, an excessively low temperature (`T=0.3`) restricts exploration too much, causing performance to plateau early.
* **Controlling the Search Space:** The top-k parameter limits sampling to the `k` most probable next tokens. The results show that a moderately large `k` (`k=40`) is beneficial, providing a good balance between exploration and staying within plausible token sequences. Completely removing this constraint (`no top k`) or using a smaller `k` (`k=20`) is slightly less effective.
* **Practical Efficiency:** The most significant accuracy gains are achieved within the first 12-20 sampled paths. This indicates a practical trade-off: beyond this point, the computational cost of generating and evaluating more paths yields only marginal improvements. The optimal operating point for efficiency versus performance appears to be in the 16-24 path range for the best-performing configurations.
In summary, the chart provides empirical evidence that **stochastic sampling with appropriately tuned temperature and top-k parameters, followed by aggregation, is a powerful method for boosting the reliability of model outputs**, significantly outperforming standard greedy decoding.