## Line Graph: Accuracy vs. #Sampled Reasoning Paths
### Overview
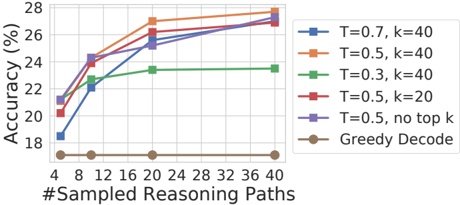
The graph illustrates how accuracy (%) improves as the number of sampled reasoning paths increases, comparing different sampling strategies (temperature `T`, top-k sampling `k`, and greedy decoding). Six data series are plotted, with accuracy ranging from 18% to 28% across 4 to 40 sampled paths.
### Components/Axes
- **X-axis**: `#Sampled Reasoning Paths` (values: 4, 8, 12, 16, 20, 24, 28, 32, 36, 40).
- **Y-axis**: `Accuracy (%)` (range: 18% to 28%).
- **Legend**: Located in the top-right corner, mapping colors to strategies:
- Blue: `T=0.7, k=40`
- Orange: `T=0.5, k=40`
- Green: `T=0.3, k=40`
- Red: `T=0.5, k=20`
- Purple: `T=0.5, no top k`
- Brown: `Greedy Decode`
### Detailed Analysis
1. **Blue Line (`T=0.7, k=40`)**:
- Starts at ~18% (4 paths) and rises sharply to ~26% (40 paths).
- Steepest slope among all strategies.
2. **Orange Line (`T=0.5, k=40`)**:
- Begins at ~20% (4 paths) and increases to ~27.5% (40 paths).
- Slightly less steep than the blue line.
3. **Green Line (`T=0.3, k=40`)**:
- Starts at ~22% (4 paths) and plateaus at ~23.5% (40 paths).
- Minimal improvement with more paths.
4. **Red Line (`T=0.5, k=20`)**:
- Begins at ~20% (4 paths) and rises to ~26% (40 paths).
- Less improvement than `k=40` strategies.
5. **Purple Line (`T=0.5, no top k`)**:
- Starts at ~22% (4 paths) and reaches ~27% (40 paths).
- Outperforms `k=20` but lags behind `k=40`.
6. **Brown Line (`Greedy Decode`)**:
- Flat line at ~18% across all path counts.
- No improvement with increased sampling.
### Key Observations
- **Temperature Impact**: Higher `T` (0.7) yields the largest accuracy gains (blue line).
- **Top-k Sampling**: Larger `k` (40 vs. 20) improves performance, especially at lower `T` (e.g., green vs. red lines).
- **Greedy Decoding**: Performs worst, showing no benefit from sampling.
- **Diminishing Returns**: At `T=0.3`, accuracy plateaus quickly (green line).
### Interpretation
The data suggests that **sampling diversity** (via temperature and top-k) significantly impacts accuracy. Higher `T` and larger `k` values enable broader exploration of reasoning paths, leading to better performance. Greedy decoding, which lacks sampling, fails to improve with more paths. The purple line (`T=0.5, no top k`) implies that alternative sampling methods (e.g., nucleus sampling) can bridge the gap between `k=20` and `k=40`. Notably, the green line (`T=0.3, k=40`) highlights that low temperature limits exploration, even with large `k`. These trends underscore the importance of balancing exploration (via `T` and `k`) and exploitation in reasoning tasks.