## Line Graph: ΔAMSC vs. η with Varying δ Parameters
### Overview
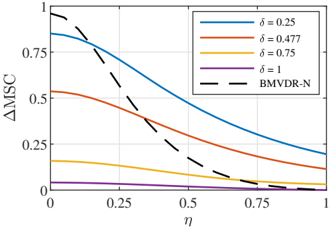
The image is a line graph comparing the performance metric ΔAMSC (y-axis) across different values of η (x-axis, ranging from 0 to 1). Four solid-colored lines represent different δ parameter values (0.25, 0.477, 0.75, 1), while a dashed black line labeled "BMVDR-N" serves as a reference. All lines exhibit downward trends, but with distinct starting points and slopes.
### Components/Axes
- **X-axis (η)**: Labeled "η", scaled from 0 to 1 in increments of 0.25.
- **Y-axis (ΔAMSC)**: Labeled "ΔAMSC", scaled from 0 to 1 in increments of 0.25.
- **Legend**: Located in the top-right corner, with:
- Solid blue line: δ = 0.25
- Solid red line: δ = 0.477
- Solid orange line: δ = 0.75
- Solid purple line: δ = 1
- Dashed black line: BMVDR-N
### Detailed Analysis
1. **δ = 0.25 (Blue Line)**:
- Starts at ~0.85 ΔAMSC at η = 0.
- Declines gradually, ending near ~0.2 at η = 1.
- Maintains the highest ΔAMSC across all η values.
2. **δ = 0.477 (Red Line)**:
- Starts at ~0.6 ΔAMSC at η = 0.
- Declines steadily, ending near ~0.15 at η = 1.
- Second-highest performance overall.
3. **δ = 0.75 (Orange Line)**:
- Starts at ~0.3 ΔAMSC at η = 0.
- Declines moderately, ending near ~0.05 at η = 1.
- Third-highest performance.
4. **δ = 1 (Purple Line)**:
- Starts at ~0.1 ΔAMSC at η = 0.
- Declines slightly, ending near ~0.02 at η = 1.
- Lowest performance across all η.
5. **BMVDR-N (Dashed Black Line)**:
- Starts at ~1.0 ΔAMSC at η = 0.
- Declines sharply, crossing below all δ lines by η = 0.5.
- Ends near ~0.05 at η = 1.
### Key Observations
- **BMVDR-N Dominance at Low η**: BMVDR-N outperforms all δ values at η = 0 but degrades rapidly as η increases.
- **δ Parameter Trade-off**: Higher δ values (e.g., δ = 1) start with lower ΔAMSC but degrade more slowly than lower δ values (e.g., δ = 0.25).
- **Convergence at High η**: All lines converge near ΔAMSC = 0.05 by η = 1, suggesting diminishing returns for all configurations at high η.
### Interpretation
The graph demonstrates a trade-off between initial performance (η = 0) and robustness to increasing η. BMVDR-N excels in low-η scenarios but becomes outperformed by δ-based configurations as η grows. Higher δ values sacrifice initial performance for stability, while lower δ values (e.g., δ = 0.25) prioritize initial gains at the cost of rapid degradation. This suggests δ tuning is critical for balancing η-dependent performance requirements. The sharp decline of BMVDR-N implies it may be unsuitable for applications with variable or high η values.