## Chart: Answer Accuracy vs. Layer for Llama Models
### Overview
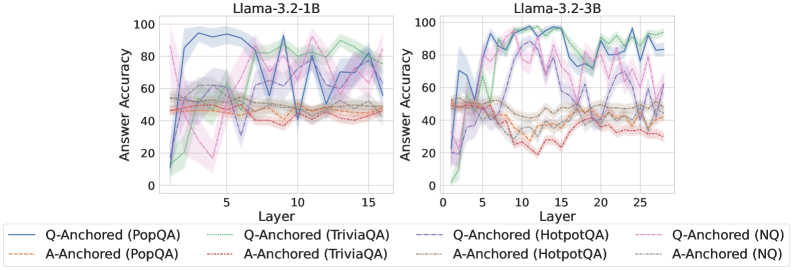
The image presents two line charts comparing the answer accuracy of Llama models (3.2-1B and 3.2-3B) across different layers. The x-axis represents the layer number, and the y-axis represents the answer accuracy. Each chart displays six data series, representing different question-answering tasks (PopQA, TriviaQA, HotpotQA, and NQ) anchored by either the question (Q-Anchored) or the answer (A-Anchored). Shaded regions around the lines indicate uncertainty or variance.
### Components/Axes
* **Titles:**
* Left Chart: "Llama-3.2-1B"
* Right Chart: "Llama-3.2-3B"
* **X-axis:**
* Label: "Layer"
* Left Chart: Scale from 0 to 15, with tick marks at 0, 5, 10, and 15.
* Right Chart: Scale from 0 to 25, with tick marks at 0, 5, 10, 15, 20, and 25.
* **Y-axis:**
* Label: "Answer Accuracy"
* Scale: 0 to 100, with tick marks at 0, 20, 40, 60, 80, and 100.
* **Legend:** Located at the bottom of the image.
* **Q-Anchored (PopQA):** Solid blue line
* **A-Anchored (PopQA):** Dashed brown line
* **Q-Anchored (TriviaQA):** Dotted green line
* **A-Anchored (TriviaQA):** Dashed-dotted orange line
* **Q-Anchored (HotpotQA):** Dashed purple line
* **A-Anchored (HotpotQA):** Dotted gray line
* **Q-Anchored (NQ):** Dashed-dotted pink line
* **A-Anchored (NQ):** Dotted black line
### Detailed Analysis
**Left Chart (Llama-3.2-1B):**
* **Q-Anchored (PopQA):** (Solid Blue) Starts around 10% accuracy at layer 1, rises sharply to approximately 95% by layer 5, then fluctuates between 85% and 95% for the remaining layers.
* **A-Anchored (PopQA):** (Dashed Brown) Remains relatively stable around 50% accuracy across all layers.
* **Q-Anchored (TriviaQA):** (Dotted Green) Starts around 20% accuracy at layer 1, rises to approximately 85% by layer 12, then fluctuates between 75% and 85% for the remaining layers.
* **A-Anchored (TriviaQA):** (Dashed-dotted Orange) Remains relatively stable around 50% accuracy across all layers.
* **Q-Anchored (HotpotQA):** (Dashed Purple) Starts around 10% accuracy at layer 1, rises to approximately 60% by layer 5, then fluctuates between 40% and 60% for the remaining layers.
* **A-Anchored (HotpotQA):** (Dotted Gray) Remains relatively stable around 55% accuracy across all layers.
* **Q-Anchored (NQ):** (Dashed-dotted Pink) Starts around 50% accuracy at layer 1, drops to approximately 15% by layer 5, then fluctuates between 35% and 55% for the remaining layers.
* **A-Anchored (NQ):** (Dotted Black) Remains relatively stable around 55% accuracy across all layers.
**Right Chart (Llama-3.2-3B):**
* **Q-Anchored (PopQA):** (Solid Blue) Starts around 10% accuracy at layer 1, rises sharply to approximately 90% by layer 5, then fluctuates between 70% and 95% for the remaining layers.
* **A-Anchored (PopQA):** (Dashed Brown) Remains relatively stable around 40% accuracy across all layers.
* **Q-Anchored (TriviaQA):** (Dotted Green) Starts around 0% accuracy at layer 1, rises to approximately 95% by layer 12, then fluctuates between 80% and 95% for the remaining layers.
* **A-Anchored (TriviaQA):** (Dashed-dotted Orange) Remains relatively stable around 50% accuracy across all layers.
* **Q-Anchored (HotpotQA):** (Dashed Purple) Starts around 10% accuracy at layer 1, rises to approximately 90% by layer 12, then fluctuates between 70% and 95% for the remaining layers.
* **A-Anchored (HotpotQA):** (Dotted Gray) Remains relatively stable around 40% accuracy across all layers.
* **Q-Anchored (NQ):** (Dashed-dotted Pink) Starts around 50% accuracy at layer 1, drops to approximately 15% by layer 5, then fluctuates between 20% and 50% for the remaining layers.
* **A-Anchored (NQ):** (Dotted Black) Remains relatively stable around 50% accuracy across all layers.
### Key Observations
* **Q-Anchored vs. A-Anchored:** Q-Anchored tasks generally show more significant improvement in accuracy as the layer number increases, especially for PopQA, TriviaQA, and HotpotQA. A-Anchored tasks tend to remain relatively stable across all layers.
* **Model Size:** The larger model (3.2-3B) generally achieves higher accuracy for Q-Anchored tasks compared to the smaller model (3.2-1B), particularly for TriviaQA and HotpotQA.
* **Task Difficulty:** PopQA, TriviaQA, and HotpotQA tasks show a clear learning curve for Q-Anchored versions, while NQ shows a dip in accuracy before stabilizing.
* **Variance:** The shaded regions indicate varying degrees of uncertainty in the accuracy, with some tasks showing more consistent performance than others.
### Interpretation
The data suggests that anchoring the question (Q-Anchored) is more effective for improving answer accuracy as the model processes through deeper layers, especially for PopQA, TriviaQA, and HotpotQA. This could indicate that the model benefits more from processing the question context in these tasks. The larger model size (3.2-3B) appears to enhance the learning capability for Q-Anchored tasks, leading to higher overall accuracy. The relatively stable performance of A-Anchored tasks suggests that the answer context alone might not be sufficient for significant improvement as the model deepens. The dip in accuracy for Q-Anchored (NQ) in both models could indicate a different processing requirement or inherent difficulty in the NQ task. Overall, the charts highlight the impact of model size, anchoring strategy, and task type on the answer accuracy of Llama models.