\n
## Line Chart: Answer Accuracy vs. Layer for Llama Models
### Overview
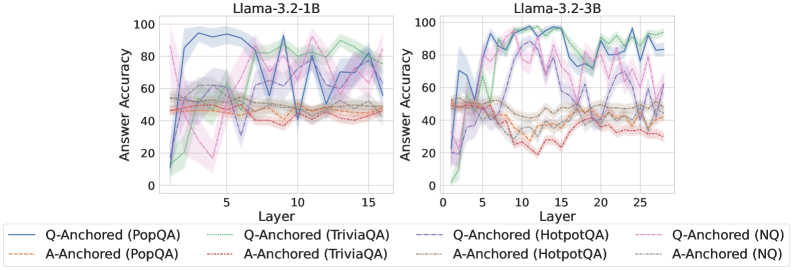
The image presents two line charts comparing the answer accuracy of different question-answering (QA) datasets across layers of two Llama models: Llama-3.2-1B and Llama-3.2-3B. The x-axis represents the layer number, and the y-axis represents the answer accuracy, ranging from 0 to 100. Each line represents a different QA dataset and anchoring method (Q-Anchored or A-Anchored). The charts are positioned side-by-side for direct comparison.
### Components/Axes
* **X-axis:** Layer (ranging from approximately 0 to 15 for the 1B model and 0 to 25 for the 3B model).
* **Y-axis:** Answer Accuracy (ranging from 0 to 100).
* **Left Chart Title:** Llama-3.2-1B
* **Right Chart Title:** Llama-3.2-3B
* **Legend:** Located at the bottom of the image, containing the following labels and corresponding colors:
* Q-Anchored (PopQA) - Blue
* A-Anchored (PopQA) - Orange
* Q-Anchored (TriviaQA) - Green
* A-Anchored (TriviaQA) - Pink
* Q-Anchored (HotpotQA) - Light Blue (dashed)
* A-Anchored (HotpotQA) - Purple (dashed)
* Q-Anchored (NQ) - Dark Blue
* A-Anchored (NQ) - Brown
### Detailed Analysis or Content Details
**Llama-3.2-1B Chart (Left):**
* **Q-Anchored (PopQA) - Blue:** Starts at approximately 90% accuracy at layer 0, dips to around 50% at layer 2, then fluctuates between 60-80% for layers 3-15.
* **A-Anchored (PopQA) - Orange:** Starts at approximately 20% accuracy at layer 0, rises to around 40% at layer 3, and remains relatively stable between 30-50% for layers 4-15.
* **Q-Anchored (TriviaQA) - Green:** Starts at approximately 20% accuracy at layer 0, rises to around 80% at layer 5, then fluctuates between 60-90% for layers 6-15.
* **A-Anchored (TriviaQA) - Pink:** Starts at approximately 20% accuracy at layer 0, rises to around 60% at layer 5, then fluctuates between 40-70% for layers 6-15.
* **Q-Anchored (HotpotQA) - Light Blue (dashed):** Starts at approximately 60% accuracy at layer 0, dips to around 20% at layer 2, then fluctuates between 40-70% for layers 3-15.
* **A-Anchored (HotpotQA) - Purple (dashed):** Starts at approximately 40% accuracy at layer 0, dips to around 20% at layer 2, then fluctuates between 30-50% for layers 3-15.
* **Q-Anchored (NQ) - Dark Blue:** Starts at approximately 60% accuracy at layer 0, dips to around 30% at layer 2, then fluctuates between 40-60% for layers 3-15.
* **A-Anchored (NQ) - Brown:** Starts at approximately 20% accuracy at layer 0, rises to around 40% at layer 3, and remains relatively stable between 30-50% for layers 4-15.
**Llama-3.2-3B Chart (Right):**
* **Q-Anchored (PopQA) - Blue:** Starts at approximately 90% accuracy at layer 0, dips to around 50% at layer 2, then fluctuates between 60-90% for layers 3-25.
* **A-Anchored (PopQA) - Orange:** Starts at approximately 20% accuracy at layer 0, rises to around 40% at layer 3, and remains relatively stable between 30-50% for layers 4-25.
* **Q-Anchored (TriviaQA) - Green:** Starts at approximately 20% accuracy at layer 0, rises to around 90% at layer 5, then fluctuates between 60-90% for layers 6-25.
* **A-Anchored (TriviaQA) - Pink:** Starts at approximately 20% accuracy at layer 0, rises to around 60% at layer 5, then fluctuates between 40-70% for layers 6-25.
* **Q-Anchored (HotpotQA) - Light Blue (dashed):** Starts at approximately 60% accuracy at layer 0, dips to around 20% at layer 2, then fluctuates between 40-80% for layers 3-25.
* **A-Anchored (HotpotQA) - Purple (dashed):** Starts at approximately 40% accuracy at layer 0, dips to around 20% at layer 2, then fluctuates between 30-50% for layers 3-25.
* **Q-Anchored (NQ) - Dark Blue:** Starts at approximately 60% accuracy at layer 0, dips to around 30% at layer 2, then fluctuates between 40-60% for layers 3-25.
* **A-Anchored (NQ) - Brown:** Starts at approximately 20% accuracy at layer 0, rises to around 40% at layer 3, and remains relatively stable between 30-50% for layers 4-25.
### Key Observations
* **Q-Anchored generally outperforms A-Anchored:** Across all datasets, the Q-Anchored methods consistently achieve higher accuracy than the A-Anchored methods.
* **PopQA shows high initial accuracy:** The PopQA dataset, when Q-Anchored, starts with the highest accuracy in both models.
* **Accuracy fluctuates with layer:** Most datasets exhibit fluctuations in accuracy as the layer number increases, suggesting that the model's performance is not consistently improving with depth.
* **3B model shows more sustained accuracy:** The Llama-3.2-3B model generally maintains higher accuracy levels across layers compared to the Llama-3.2-1B model.
* **Initial dip in accuracy:** Many lines show a dip in accuracy around layer 2, potentially indicating a learning phase or adjustment period.
### Interpretation
The data suggests that question-anchoring (Q-Anchored) is a more effective method for improving answer accuracy in these Llama models compared to answer-anchoring (A-Anchored). The higher accuracy of the 3B model indicates that increasing model size generally leads to better performance. The fluctuations in accuracy across layers suggest that the models are not simply learning linearly with depth; there are likely complex interactions between layers and datasets. The initial dip in accuracy could be due to the model adjusting to the specific characteristics of each dataset. The PopQA dataset, with its high initial accuracy, might be easier for the models to learn or more aligned with their pre-training data. These charts provide valuable insights into the performance of Llama models on different QA tasks and can inform future model development and training strategies. The differences in performance between the 1B and 3B models highlight the importance of model scale in achieving higher accuracy.