## Line Graph: Answer Accuracy Across Layers for Llama-3.2 Models
### Overview
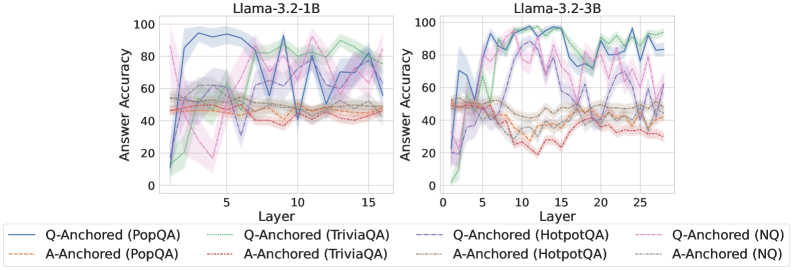
The image contains two side-by-side line graphs comparing answer accuracy across transformer model layers for two Llama-3.2 variants (1B and 3B parameter sizes). Each graph shows multiple data series representing different question-answering datasets (PopQA, TriviaQA, HotpotQA, NQ) and anchoring methods (Q-Anchored vs A-Anchored). The graphs use color-coded lines with distinct line styles to differentiate datasets and anchoring approaches.
### Components/Axes
- **X-axis (Layer)**:
- Left chart: 0–15 (Llama-3.2-1B)
- Right chart: 0–25 (Llama-3.2-3B)
- Discrete integer values representing transformer layers
- **Y-axis (Answer Accuracy)**:
- Scale: 0–100% (both charts)
- Continuous percentage values
- **Legends**:
- Positioned at bottom of each chart
- Color-coded with line styles:
- **Solid lines**: Q-Anchored methods
- **Dashed lines**: A-Anchored methods
- Datasets:
- PopQA (blue/orange)
- TriviaQA (green/brown)
- HotpotQA (purple/gray)
- NQ (pink/red)
### Detailed Analysis
#### Llama-3.2-1B (Left Chart)
- **Q-Anchored (PopQA)**:
- Solid blue line
- Starts at ~85% accuracy (Layer 0), dips to ~40% (Layer 5), then fluctuates between 50–70%
- **A-Anchored (PopQA)**:
- Dashed orange line
- Starts at ~50%, peaks at ~65% (Layer 10), then declines to ~40%
- **Q-Anchored (TriviaQA)**:
- Solid green line
- Starts at ~60%, peaks at ~80% (Layer 12), then declines to ~50%
- **A-Anchored (TriviaQA)**:
- Dashed brown line
- Starts at ~40%, peaks at ~60% (Layer 8), then declines to ~30%
- **Q-Anchored (HotpotQA)**:
- Solid purple line
- Starts at ~70%, peaks at ~90% (Layer 6), then declines to ~60%
- **A-Anchored (HotpotQA)**:
- Dashed gray line
- Starts at ~50%, peaks at ~70% (Layer 14), then declines to ~40%
- **Q-Anchored (NQ)**:
- Solid pink line
- Starts at ~55%, peaks at ~75% (Layer 3), then declines to ~50%
- **A-Anchored (NQ)**:
- Dashed red line
- Starts at ~45%, peaks at ~65% (Layer 7), then declines to ~40%
#### Llama-3.2-3B (Right Chart)
- **Q-Anchored (PopQA)**:
- Solid blue line
- Starts at ~75%, peaks at ~95% (Layer 10), then declines to ~65%
- **A-Anchored (PopQA)**:
- Dashed orange line
- Starts at ~55%, peaks at ~75% (Layer 15), then declines to ~50%
- **Q-Anchored (TriviaQA)**:
- Solid green line
- Starts at ~65%, peaks at ~85% (Layer 20), then declines to ~60%
- **A-Anchored (TriviaQA)**:
- Dashed brown line
- Starts at ~45%, peaks at ~70% (Layer 22), then declines to ~40%
- **Q-Anchored (HotpotQA)**:
- Solid purple line
- Starts at ~80%, peaks at ~100% (Layer 18), then declines to ~70%
- **A-Anchored (HotpotQA)**:
- Dashed gray line
- Starts at ~60%, peaks at ~80% (Layer 24), then declines to ~50%
- **Q-Anchored (NQ)**:
- Solid pink line
- Starts at ~60%, peaks at ~85% (Layer 12), then declines to ~55%
- **A-Anchored (NQ)**:
- Dashed red line
- Starts at ~50%, peaks at ~70% (Layer 16), then declines to ~45%
### Key Observations
1. **Model Size Impact**:
- 3B model shows higher peak accuracies (up to 100% vs 90% in 1B)
- 3B model exhibits greater layer-to-layer variability (e.g., HotpotQA Q-Anchored peaks at Layer 18)
2. **Anchoring Method Trends**:
- Q-Anchored methods consistently outperform A-Anchored across datasets
- A-Anchored methods show more gradual declines after initial peaks
3. **Dataset Variability**:
- HotpotQA Q-Anchored shows most dramatic peaks (100% in 3B model)
- NQ dataset exhibits the most erratic patterns (e.g., sharp dips in Layer 5 for 1B model)
4. **Layer-Specific Patterns**:
- Early layers (0–5) show higher variability in both models
- Middle layers (10–15 for 1B; 15–20 for 3B) show more stable performance
### Interpretation
The data suggests that:
1. **Model Size Enhances Performance**: The 3B model achieves higher peak accuracies but with increased layer-to-layer variability, indicating potential overfitting or complex internal dynamics.
2. **Q-Anchored Superiority**: Q-Anchored methods consistently outperform A-Anchored across all datasets, suggesting question-specific anchoring provides better context retention.
3. **Dataset-Specific Behavior**:
- HotpotQA benefits most from Q-Anchored methods (reaching 100% accuracy in 3B model)
- NQ dataset shows the most unstable performance, possibly due to its open-ended nature
4. **Layer Dynamics**: Early layers (0–5) may represent initial context processing, while middle layers (10–15/20) show optimized question-answer alignment.
The graphs highlight the importance of anchoring strategy and model scale in transformer-based QA systems, with larger models offering higher potential but requiring careful layer management.