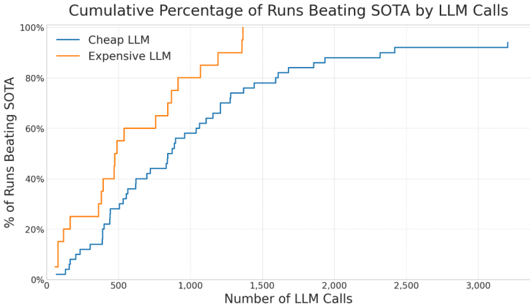
## Line Chart: Cumulative Percentage of Runs Beating SOTA by LLM Calls
### Overview
This is a line chart comparing the performance of two types of Large Language Models (LLMs) — labeled "Cheap LLM" and "Expensive LLM" — in terms of the cumulative percentage of experimental runs that beat the State-of-the-Art (SOTA) benchmark, plotted against the number of LLM calls made. The chart demonstrates the efficiency of each model type in achieving superior results with varying computational effort.
### Components/Axes
* **Title:** "Cumulative Percentage of Runs Beating SOTA by LLM Calls"
* **X-Axis (Horizontal):**
* **Label:** "Number of LLM Calls"
* **Scale:** Linear scale from 0 to 3,000.
* **Major Tick Marks:** 0, 500, 1,000, 1,500, 2,000, 2,500, 3,000.
* **Y-Axis (Vertical):**
* **Label:** "% of Runs Beating SOTA"
* **Scale:** Linear scale from 0% to 100%.
* **Major Tick Marks:** 0%, 20%, 40%, 60%, 80%, 100%.
* **Legend:**
* **Position:** Top-left corner of the chart area.
* **Entry 1:** "Cheap LLM" — represented by a solid blue line.
* **Entry 2:** "Expensive LLM" — represented by a solid orange line.
### Detailed Analysis
The chart plots two cumulative distribution functions.
**1. Expensive LLM (Orange Line):**
* **Trend:** The line exhibits a very steep, near-vertical initial ascent, indicating rapid gains in the percentage of successful runs with a relatively small number of calls. The slope gradually decreases but remains strong until it reaches the 100% ceiling.
* **Key Data Points (Approximate):**
* At ~100 calls: ~25% of runs beat SOTA.
* At ~500 calls: ~60% of runs beat SOTA.
* At ~1,000 calls: ~80% of runs beat SOTA.
* The line reaches 100% at approximately 1,400 calls and remains flat thereafter.
**2. Cheap LLM (Blue Line):**
* **Trend:** The line shows a more gradual, steady ascent. It requires significantly more calls to reach the same cumulative percentages as the Expensive LLM. The curve begins to plateau after approximately 2,000 calls.
* **Key Data Points (Approximate):**
* At ~100 calls: ~5% of runs beat SOTA.
* At ~500 calls: ~30% of runs beat SOTA.
* At ~1,000 calls: ~60% of runs beat SOTA.
* At ~2,000 calls: ~90% of runs beat SOTA.
* The line plateaus at approximately 95% from ~2,500 calls onward, never reaching 100% within the displayed range.
### Key Observations
1. **Performance Gap:** There is a substantial and consistent gap between the two lines. For any given number of LLM calls, the Expensive LLM has a significantly higher cumulative success rate.
2. **Efficiency:** The Expensive LLM is far more "call-efficient." It achieves a 60% success rate with ~500 calls, a milestone the Cheap LLM requires ~1,000 calls to reach.
3. **Ceiling Effect:** The Expensive LLM reaches 100% success within the observed window (~1,400 calls). The Cheap LLM appears to asymptote just below 100% (around 95%), suggesting a subset of runs where it may never beat SOTA, regardless of additional calls.
4. **Shape Difference:** The Expensive LLM's curve is concave (steep then flattening), while the Cheap LLM's curve is more linear for a longer duration before flattening.
### Interpretation
This chart visualizes a classic trade-off between cost (implied by "Cheap" vs. "Expensive") and computational efficiency in AI model performance. The data suggests that investing in a more expensive LLM yields a disproportionately higher return on investment in terms of task success per unit of computational effort (LLM call).
The "Expensive LLM" likely has superior reasoning, knowledge, or instruction-following capabilities, allowing it to solve the target problem correctly on the first or second attempt much more frequently. The "Cheap LLM" may require more iterative calls, self-correction, or sampling to arrive at a correct solution, hence needing more calls to accumulate successes.
The plateau of the Cheap LLM below 100% is particularly noteworthy. It implies an inherent limitation or a class of problems within the benchmark that this model type cannot solve, no matter how many attempts are granted. In contrast, the Expensive LLM's ability to reach 100% indicates it is robust enough to eventually solve all problem instances given sufficient calls.
From a practical standpoint, this analysis would inform resource allocation: if the cost of an "Expensive LLM" call is less than roughly double the cost of a "Cheap LLM" call (based on the ~2x call efficiency at the 60% mark), it would be the more cost-effective choice for achieving high reliability. The chart argues that raw cost-per-call is a misleading metric without considering the resulting success rate.